Tropical-Extratropical Interactions

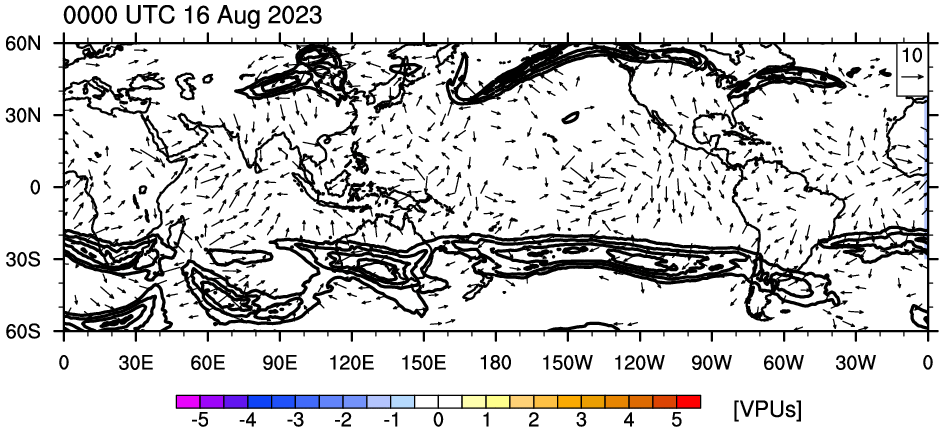
MJO-filtered 200 hPa Velocity Potential anomalies (shaded + contours),
200 hPa Winds (magnitude only; black contours; starts at 40 m/s at 10 m/s intervals),
200 hPa irrotational winds (vectors; winds greater than 4 m/s only plotted)
200 hPa Winds (magnitude only; black contours; starts at 40 m/s at 10 m/s intervals),
200 hPa irrotational winds (vectors; winds greater than 4 m/s only plotted)
Tropical-Extratropical Regional Plots
o Maps of MJO filtered VP200 anomalies; and 200 hPa Winds
o Analyses are updated at 0000, 0600, 1200, and 1800 UTC with a 12-hour lag
o Negative (cold-colored contours) MJO Filtered 200 hPa VP anomalies represent upper-level divergence
o Positive (warm-colored contours) MJO Filtered 200 hPa VP anomalies represent upper-level convergence
Latest Analysis Last 7 Days
Pacific Pacific
Atlantic Atlantic
Global Global
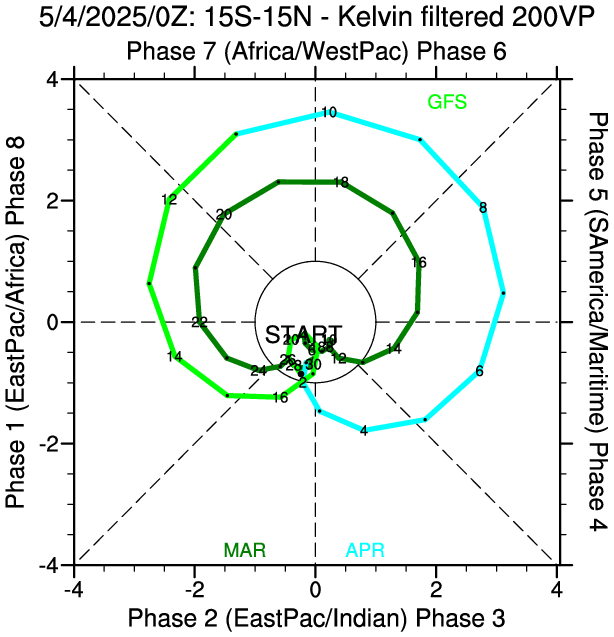
Kelvin Wave Phase Space Diagram

To construct this diagram, the GFS variables used are anomalies of (Left) Kelvin filtered 200 hPa velocity potential; To see the variance of EOFs 1 and 2, click here.
Regional KW filtered 200 hPa VP anomalies, and 200 hPa GFS Wind anomalies
o Maps of 200-hPa winds and Kelvin Filtered VP200 anomalies
o Analyses are updated at 0000, 0600, 1200, and 1800 UTC with a 12-hour lag
o Negative (cold-colored contours) Kelvin Filtered 200 hPa VP anomalies represent upper-level divergence
o Positive (warm-colored contours) Kelvin Filtered 200 hPa VP anomalies represent upper-level convergence
Latest Analysis Last 7 Days
Pacific Pacific
Atlantic Atlantic
Africa Africa
Indian Indian
Global Global
Current State (200 hPa Velocity Potential)

Regional Filtered VP200 anomaly Maps
Latest Analysis Last 7 Days
Western Hemisphere Western Hemisphere
Eastern Hemisphere Eastern Hemisphere
Global Global
Western Hemisphere Western Hemisphere
Eastern Hemisphere Eastern Hemisphere
Global Global
Kelvin Filtered Velocity Potential Time-Longitude Plots (90 Days)
o Global time–longitude GFS VP plots
o Unfiltered VP is shaded
o Negative VP = Divergence
o Kelvin Filtered Velocity Potential Anomalies are contoured and are standardized
CINT: 1 STD
o The convectively active phases of all Kelvin waves are represented by the "blue dashed" lines
o Kelvin Filtering: Wave numbers 1-14; period of 2.5-30 days; equivalent depth of 8-90m.
VP200 VP850
20°N – 30°N total anom 20°N – 30°N total anom
10°N – 20°N total anom 10°N – 20°N total anom
Eq – 10°N total anom Eq – 10°N total anom
5°S – 5°N total anom 5°S – 5°N total anom
10°S – Eq total anom 10°S – Eq total anom
20°S – 10°S total anom 20°S – 10°S total anom
30°S – 20°S total anom 30°S – 20°S total anom
