FOR Atlantic with CCKWs
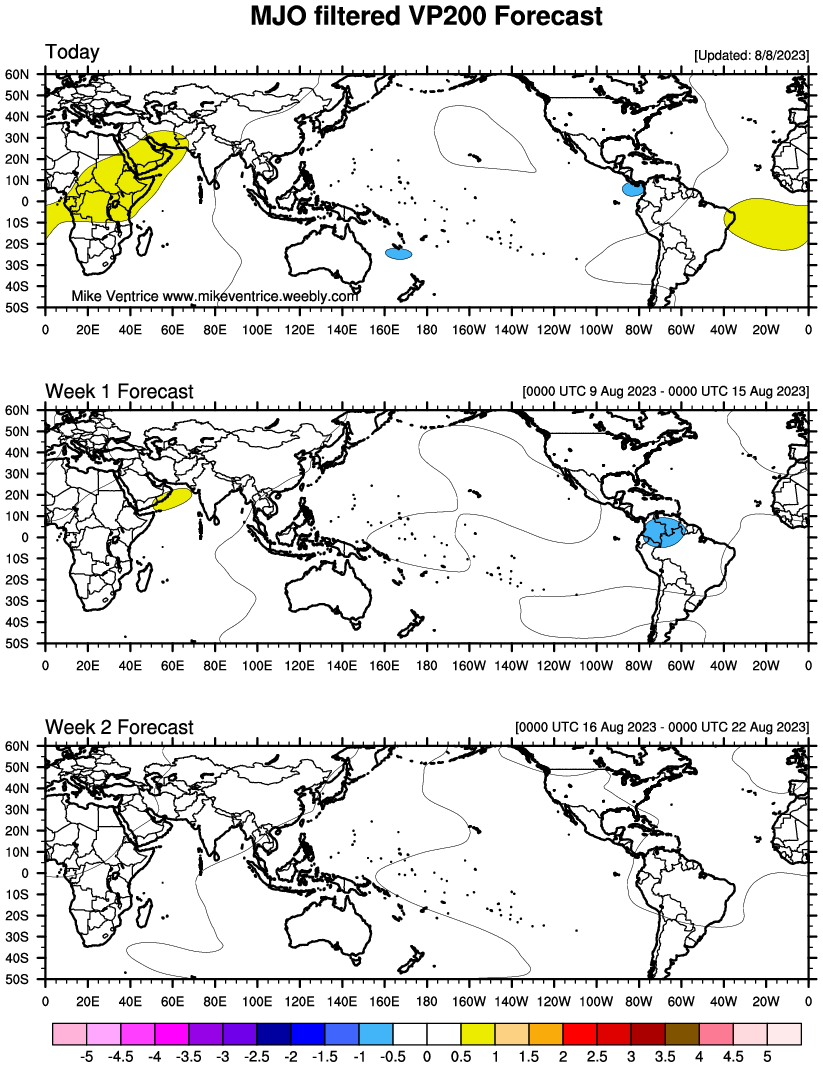
MJO filtered VP200 anomalies for the current state, for the week 1 forecast, and for the week 2 forecast.
Cold colors are representative of a more favorable state over the Atlantic for tropical cyclogenesis (typically after the passage),
and warm colors represent a less favorable state for tropical cyclogenesis.
Additional information:
This product is built using GFS 1.0 near-real time analyses back to 260 days with the current most 7-day GFS 1.0 operational forecast.
Current Day = MJO filtered VP200 anomalies (shaded) are averaged using the previous 3 days; Week 1 = MJO filtered VP200 anomalies are averaged using forecast days +1 through +7.
Week 2 is built using a simple extrapolation of the filtered fields in time using a zero-padding technique following the last day of GFS operational forecast data.
Therefore, Week 2 will always have weaker anomalies expressed when compared to Week 1 every time. Week 2 = MJO filtered VP200 anomalies is an average of forecast days +8 through +14.
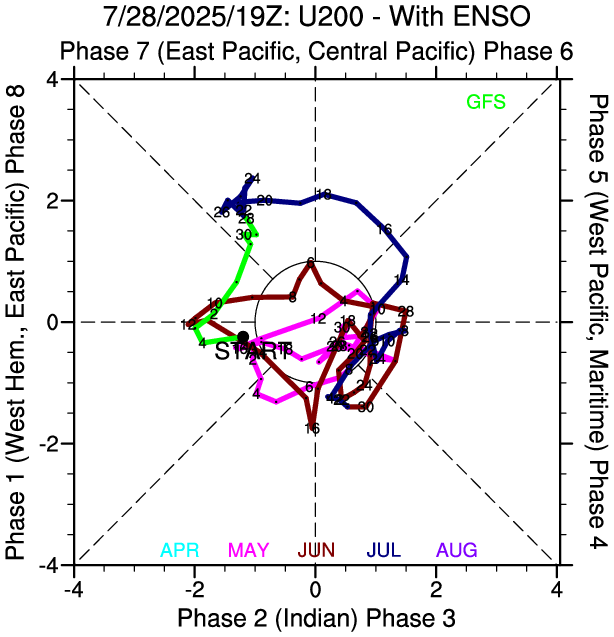
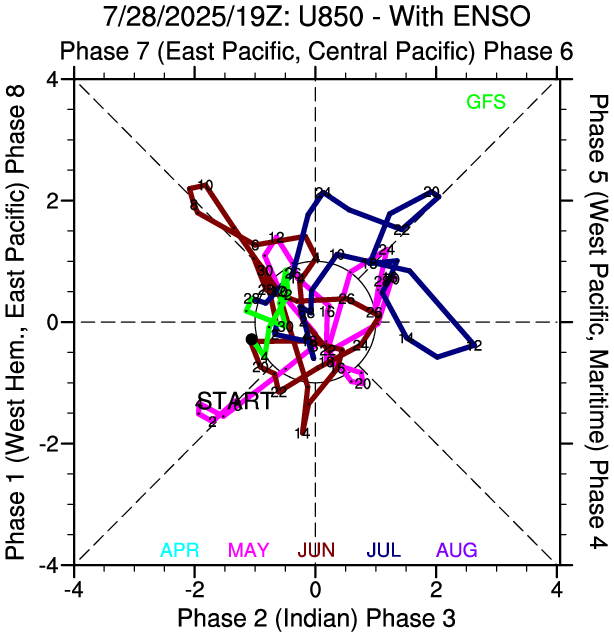
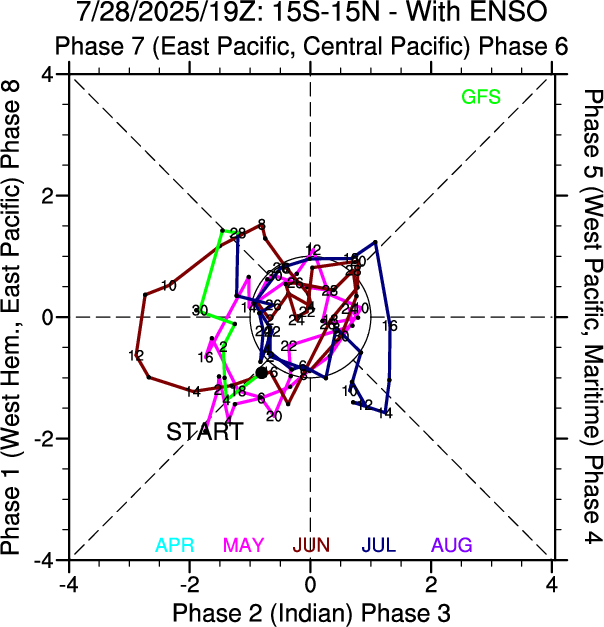
The VPM Indices
GFS variables used are VP200, U200, U850
The fractional contribution of each component on the full PC is shown in top left.
To see the variance of EOFs 1 and 2 , click here.
For the VPM index without Interannual variability retained
1989-2012 VPM Climatology (Without ENSO)
1989-2009 Partial Fraction Contribution Climatology (Without ENSO)
The fractional contribution of each component on the full PC is shown in top left.
To see the variance of EOFs 1 and 2 , click here.
For the VPM index without Interannual variability retained
1989-2012 VPM Climatology (Without ENSO)
1989-2009 Partial Fraction Contribution Climatology (Without ENSO)
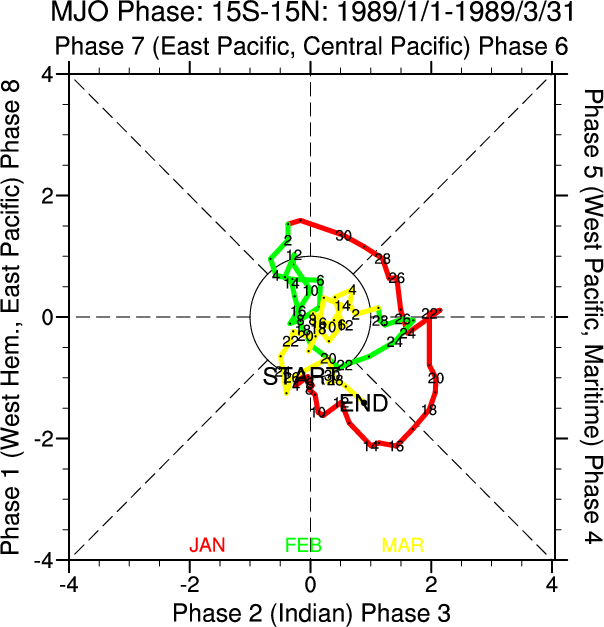
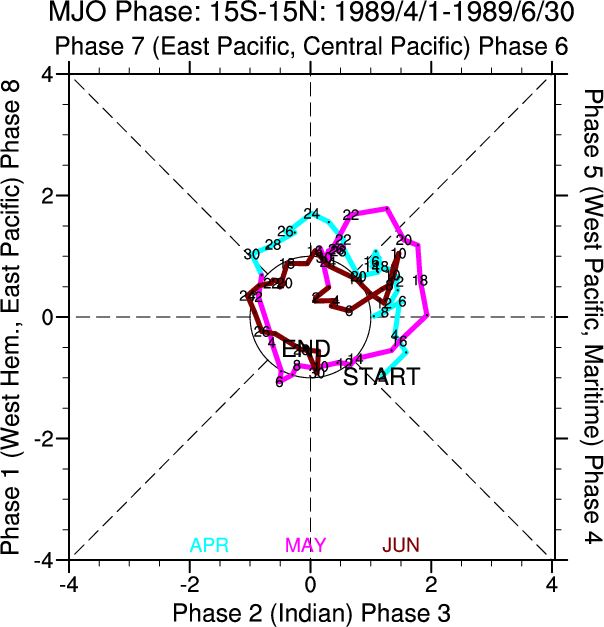
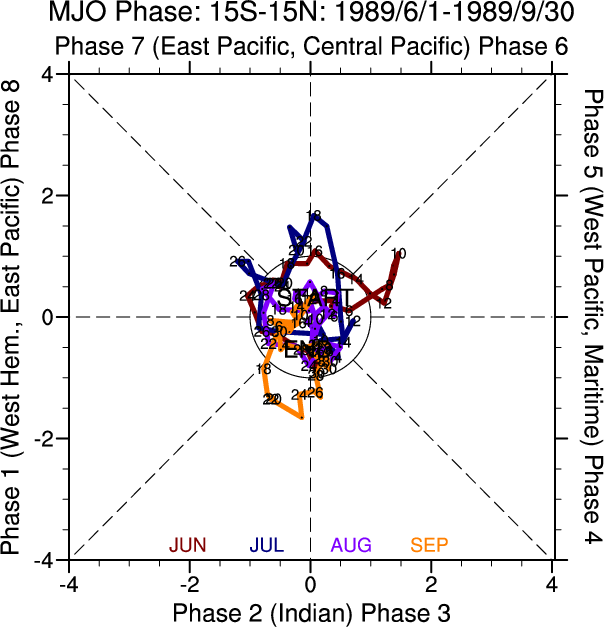
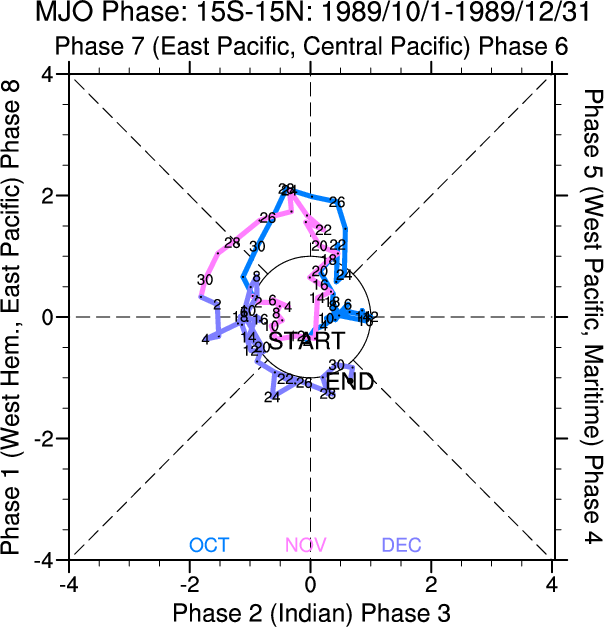
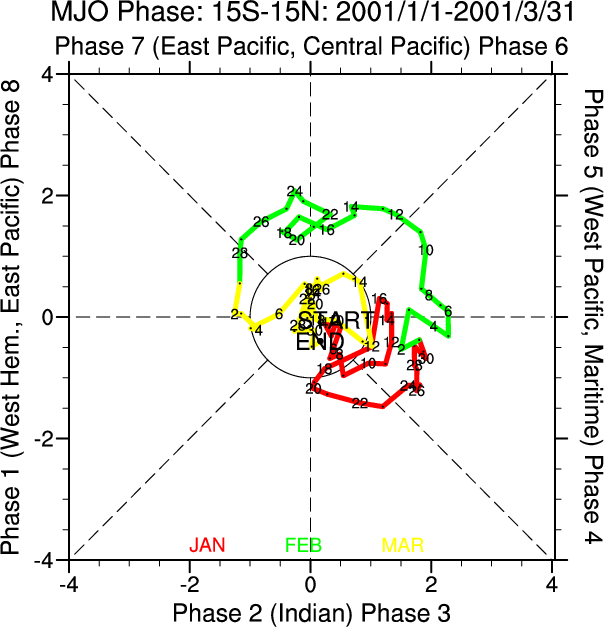
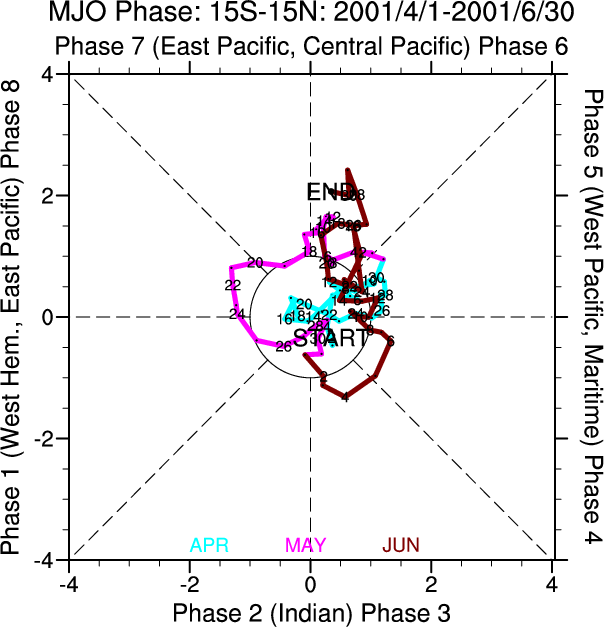
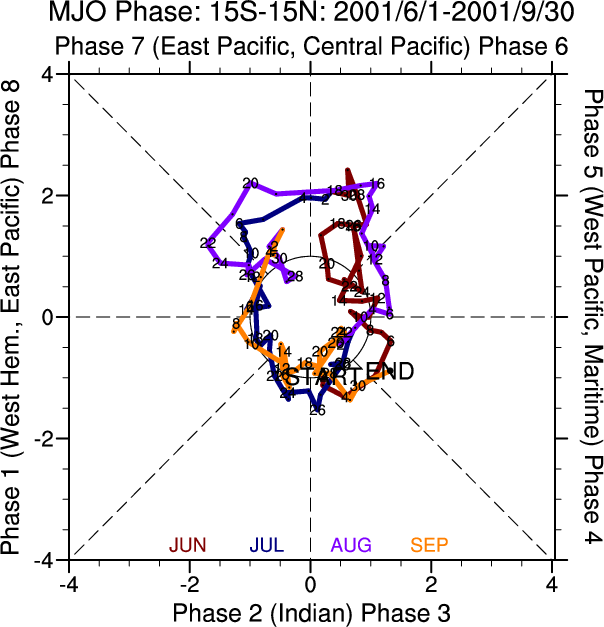
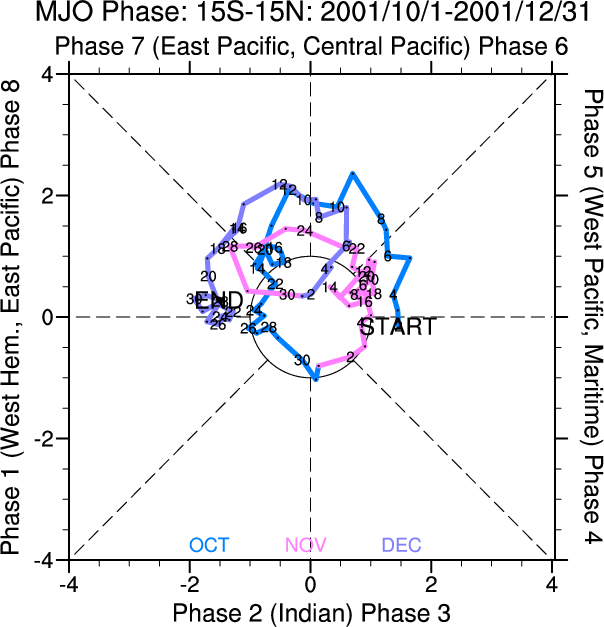
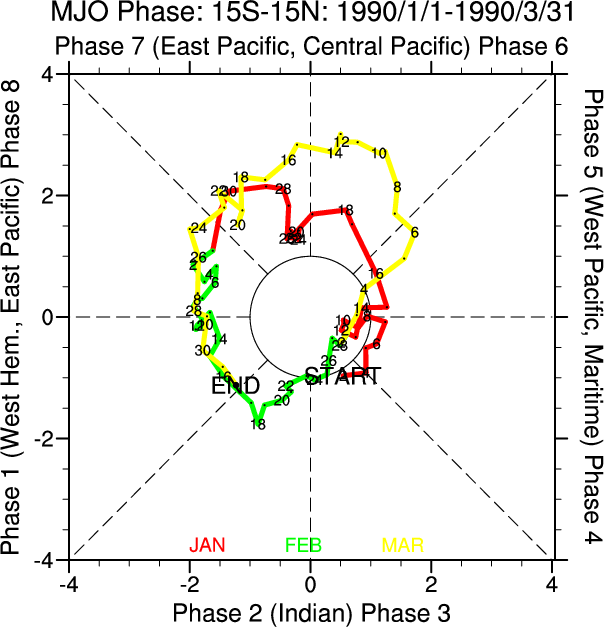
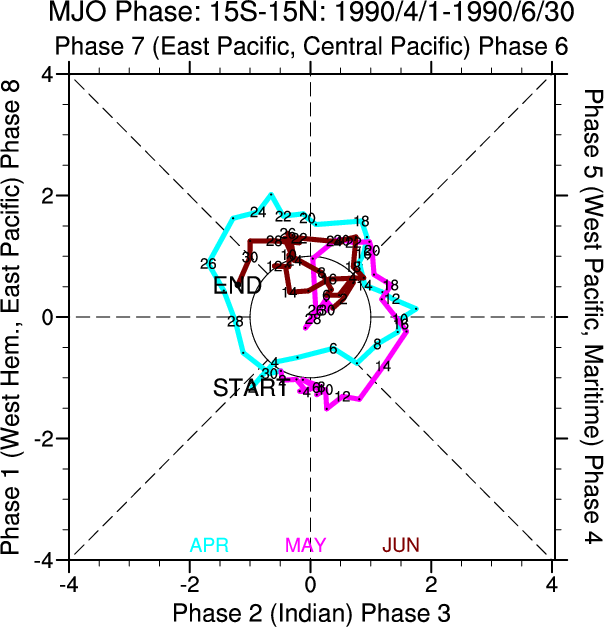
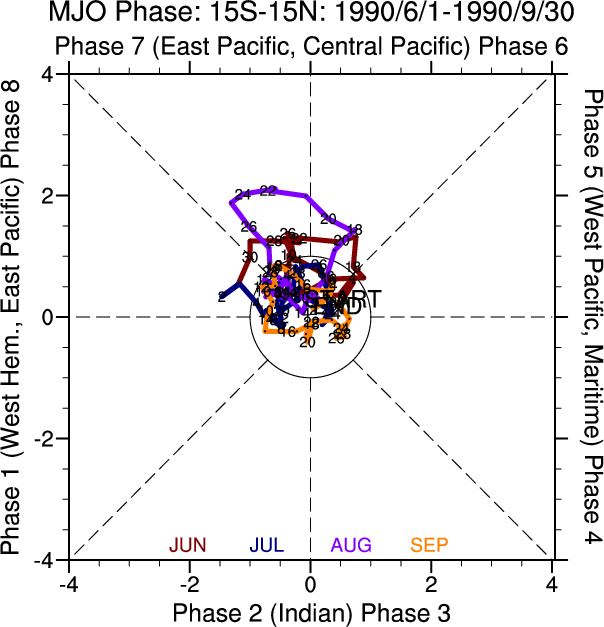
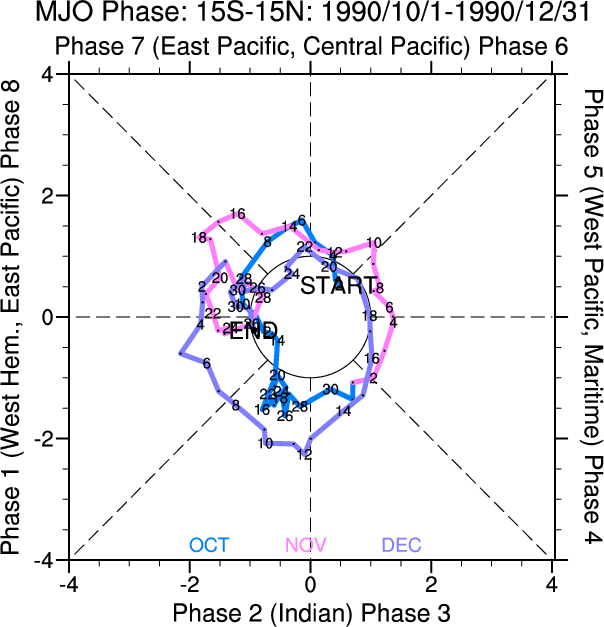
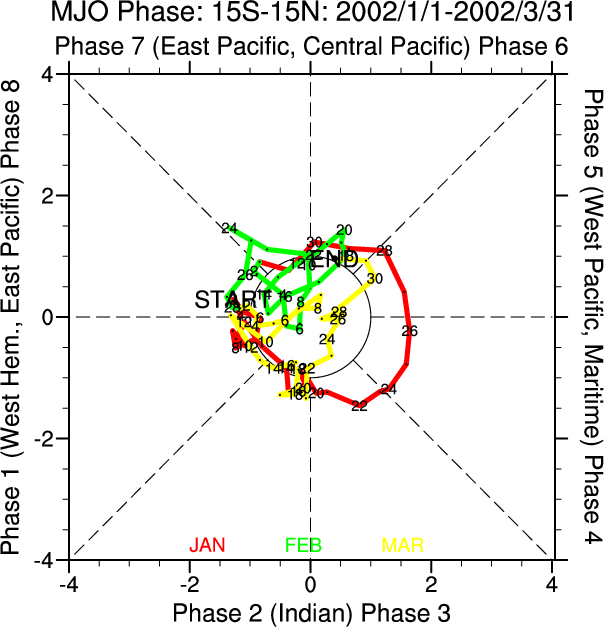
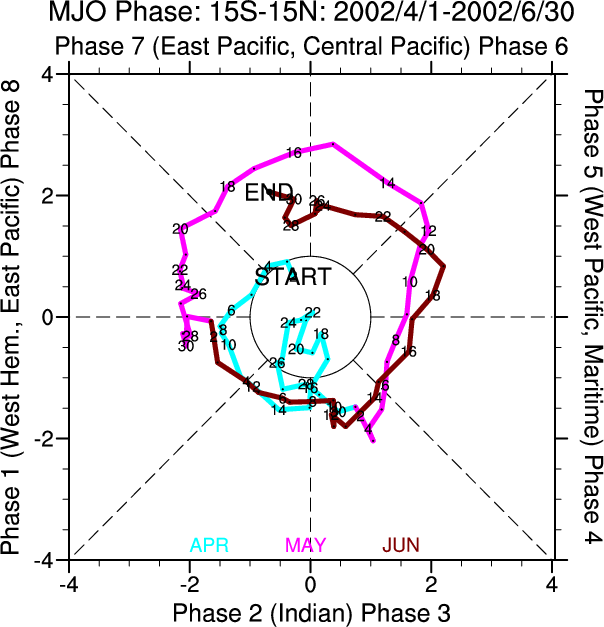
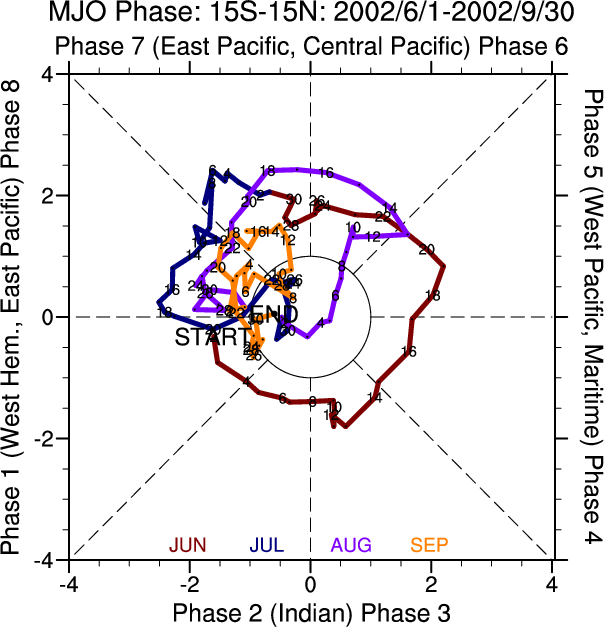
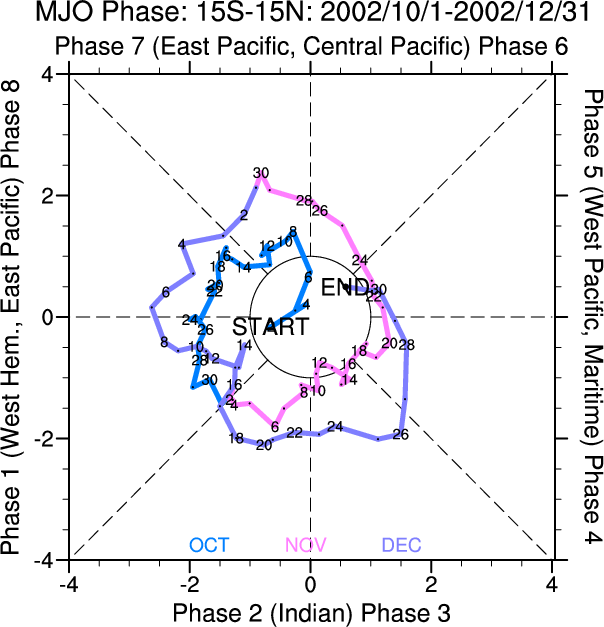
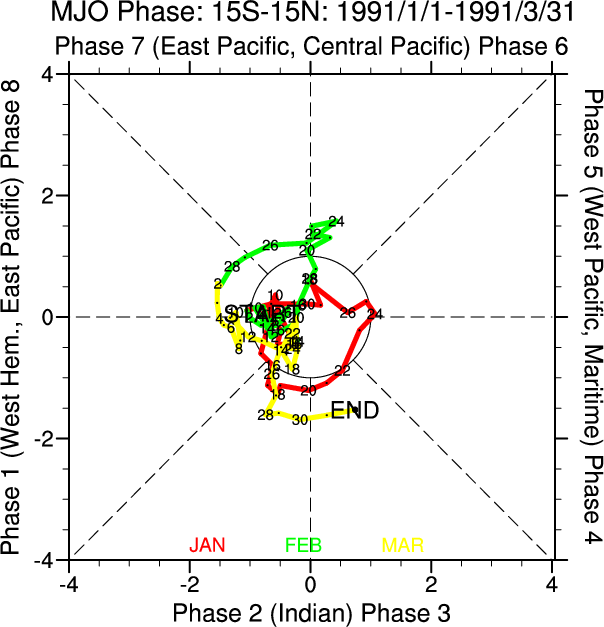
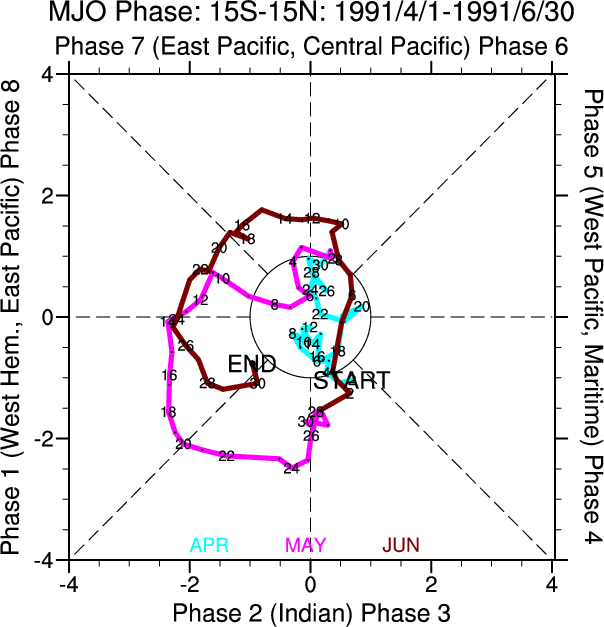
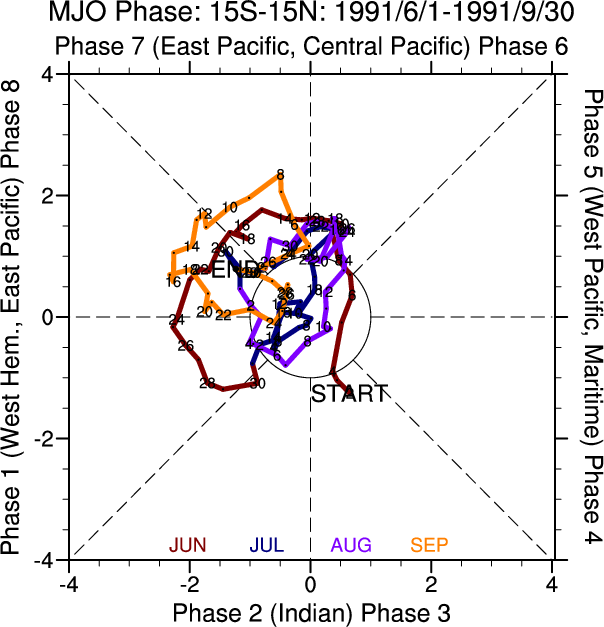
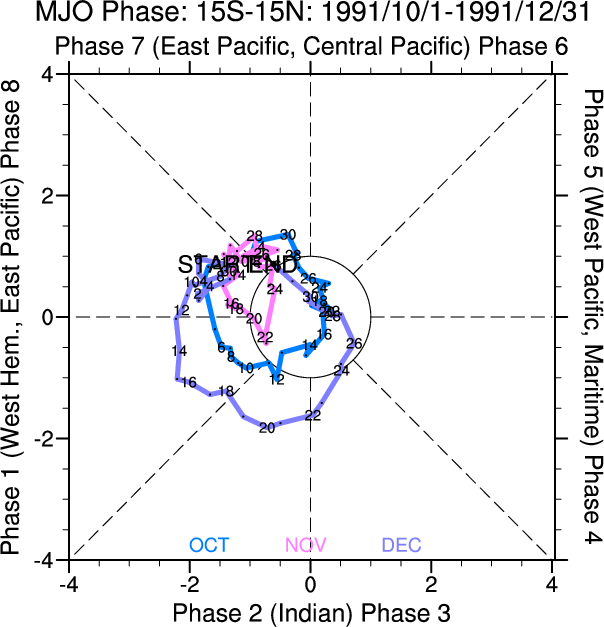
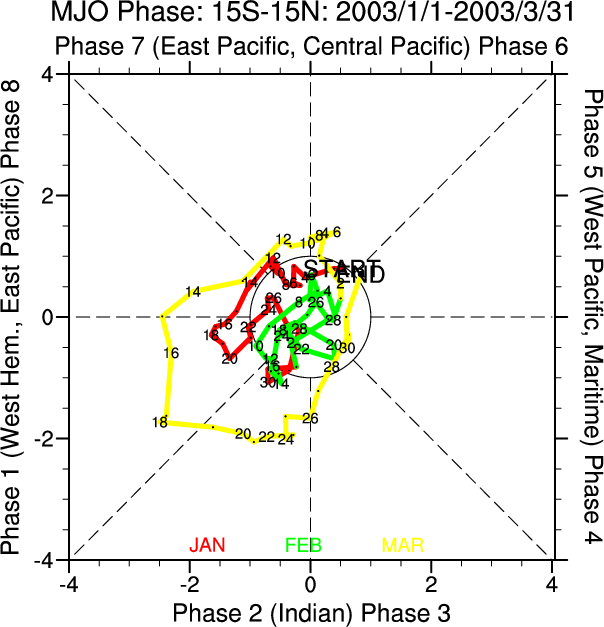
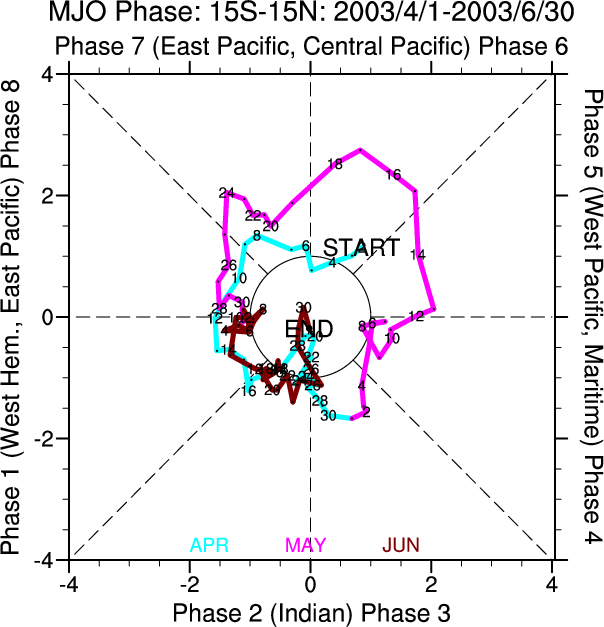
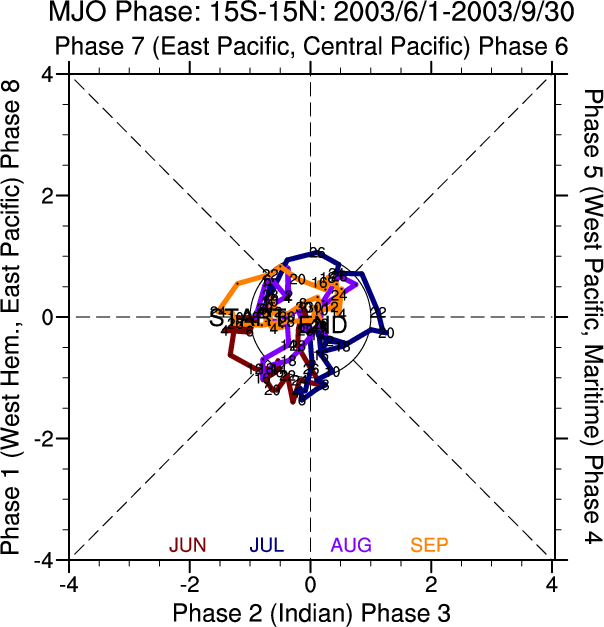
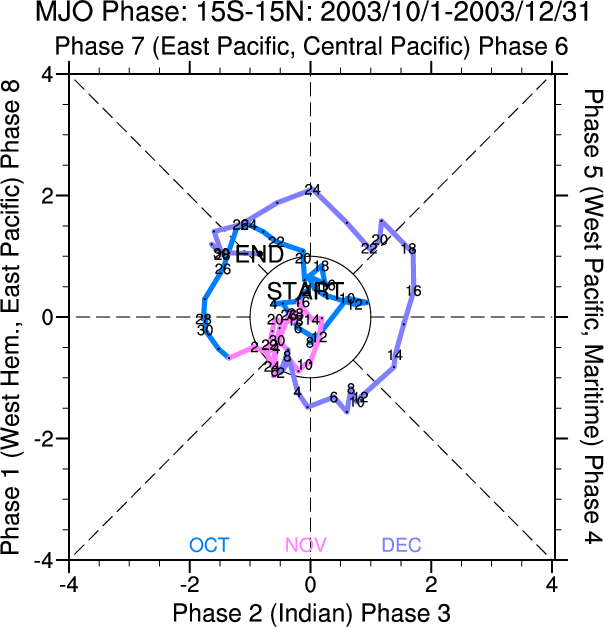
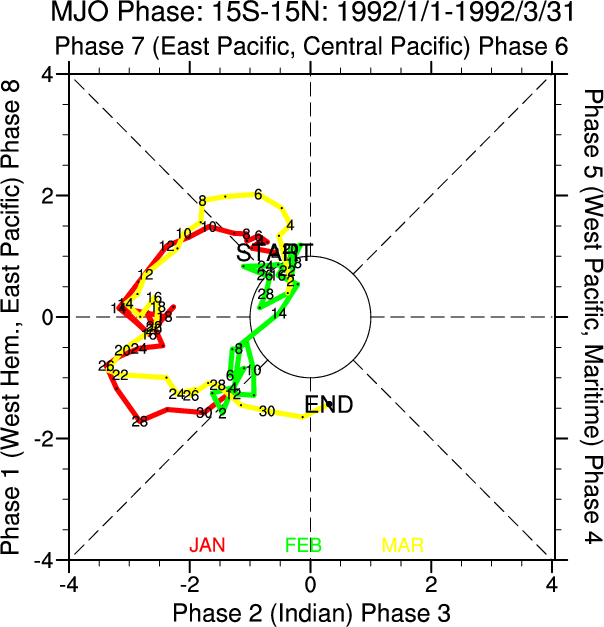
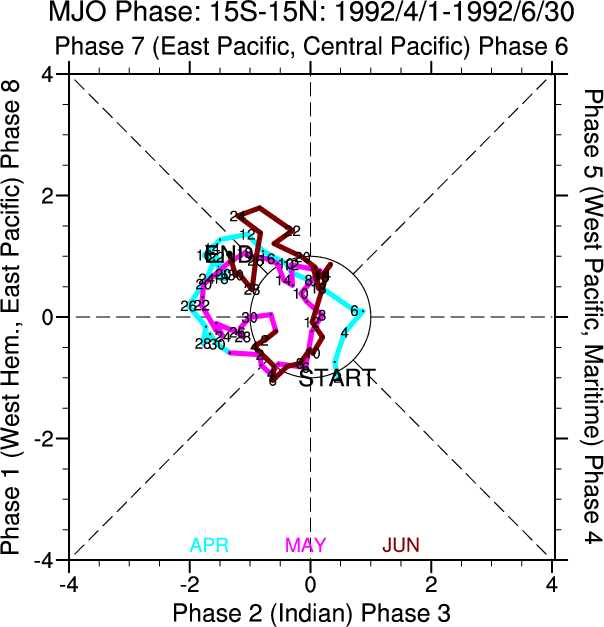
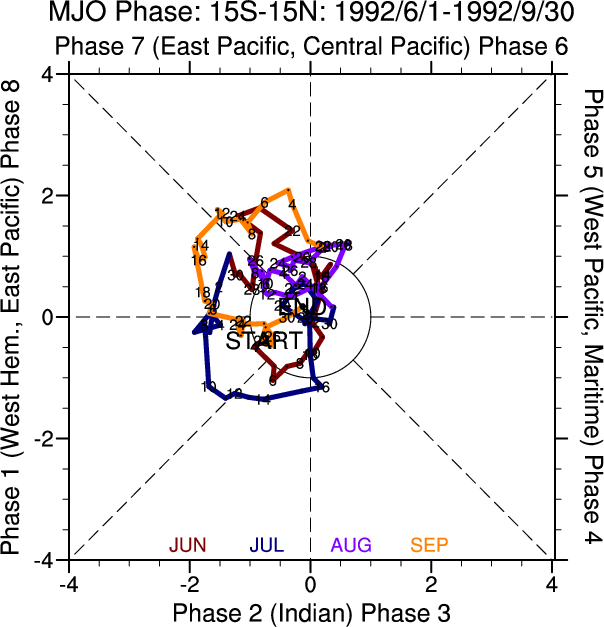
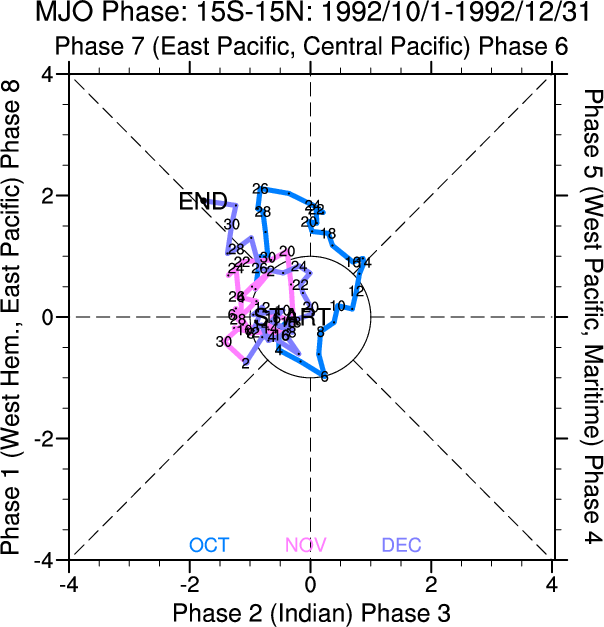
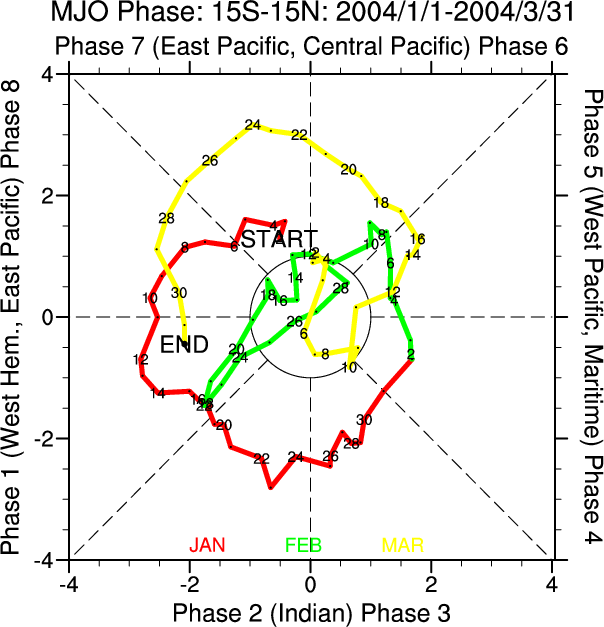
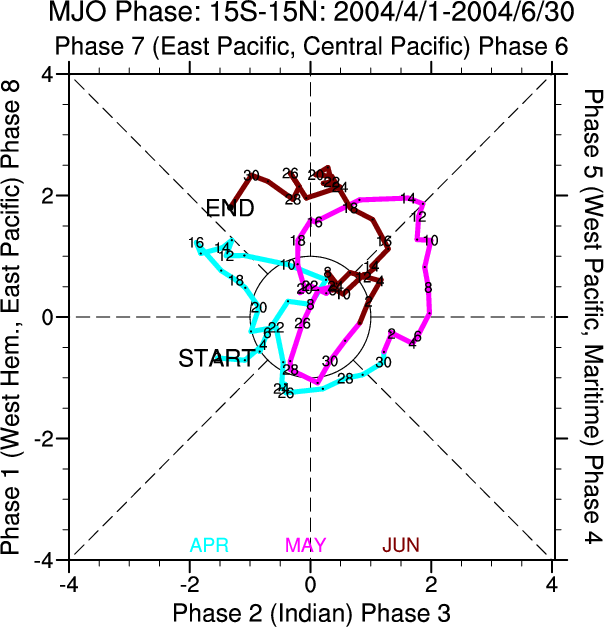
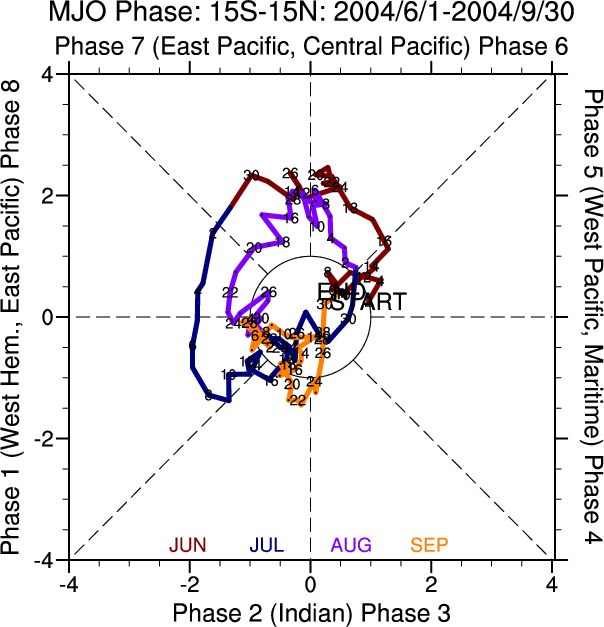
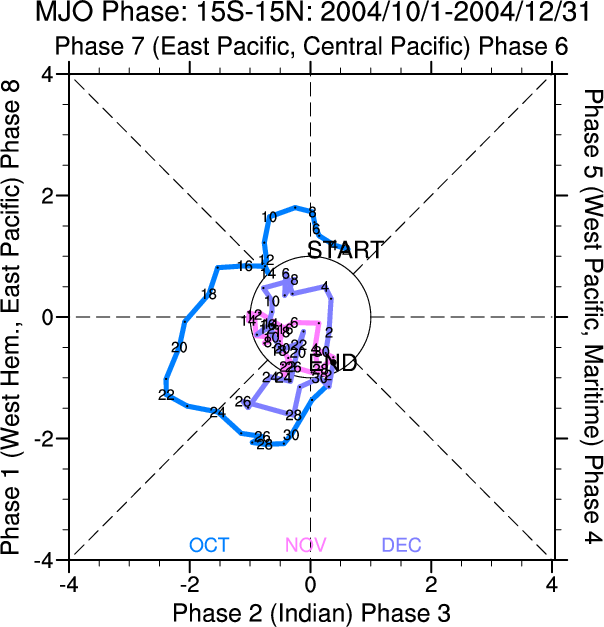
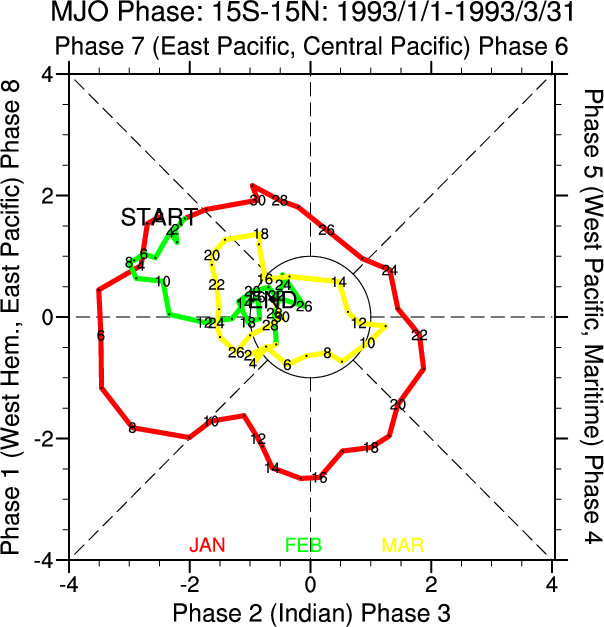
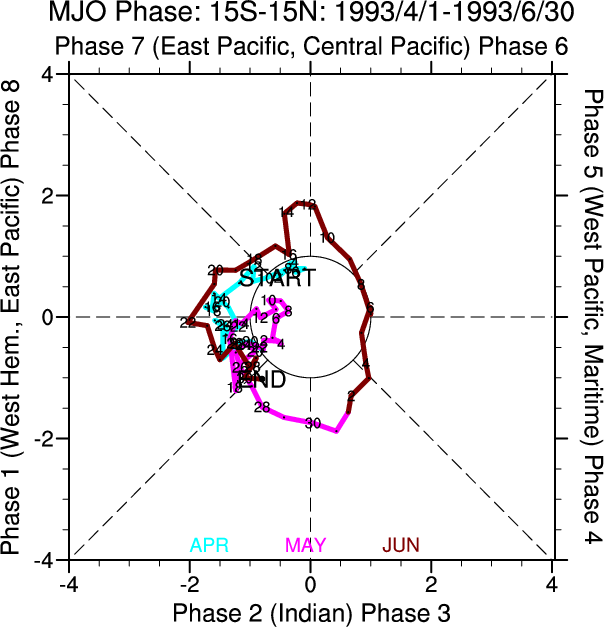
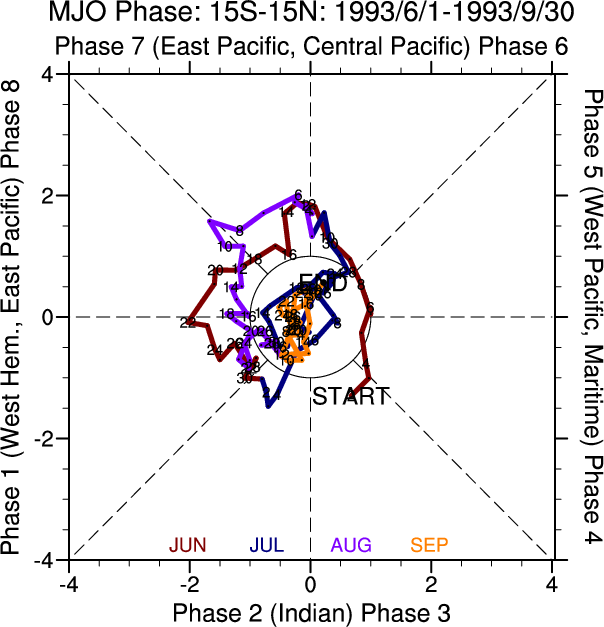
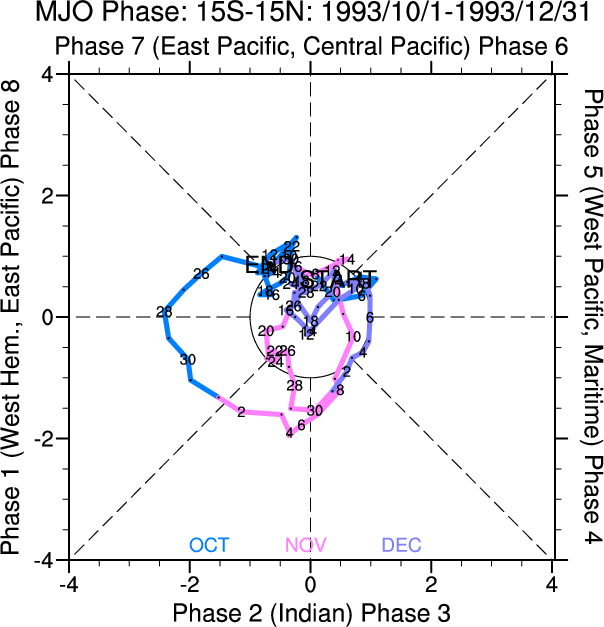
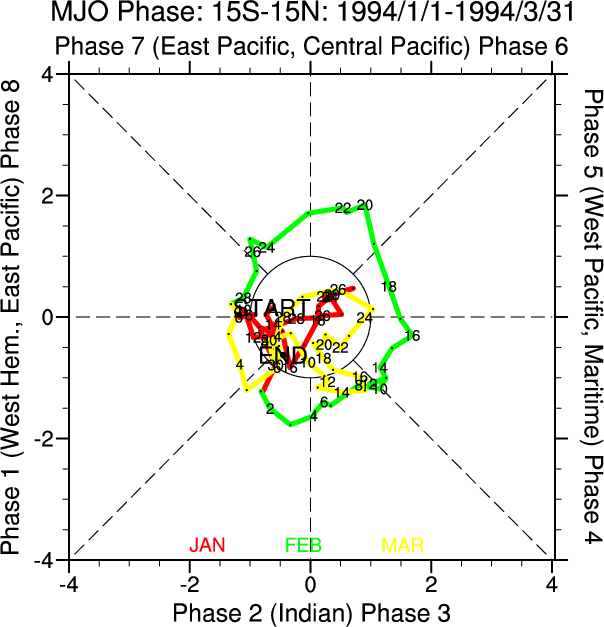
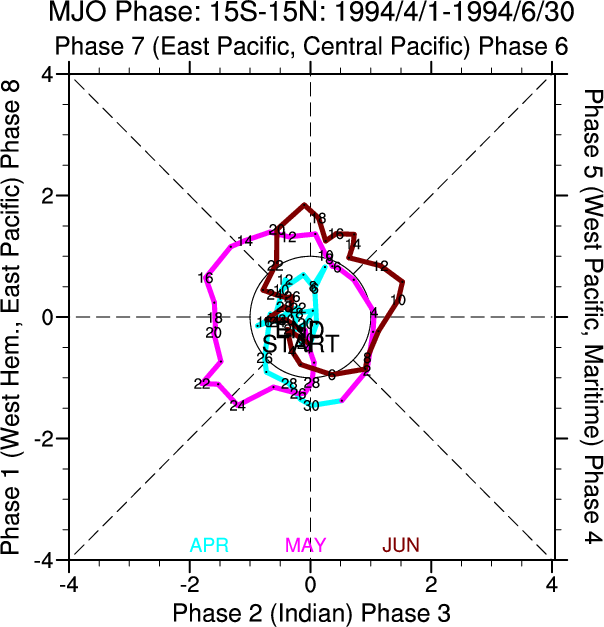
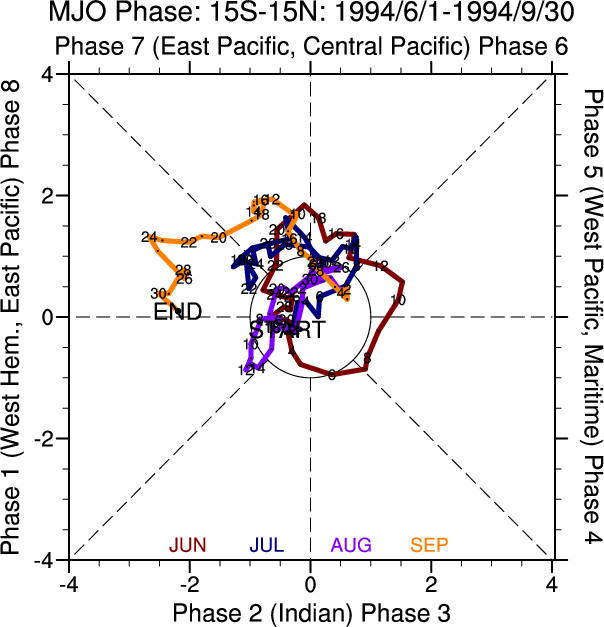
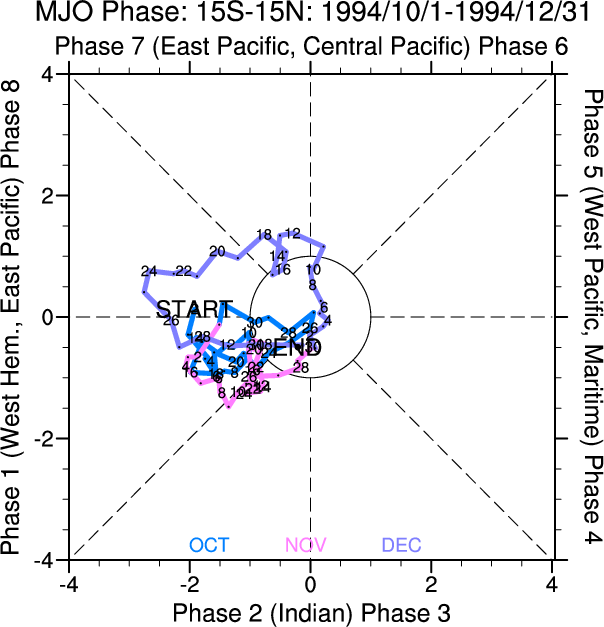
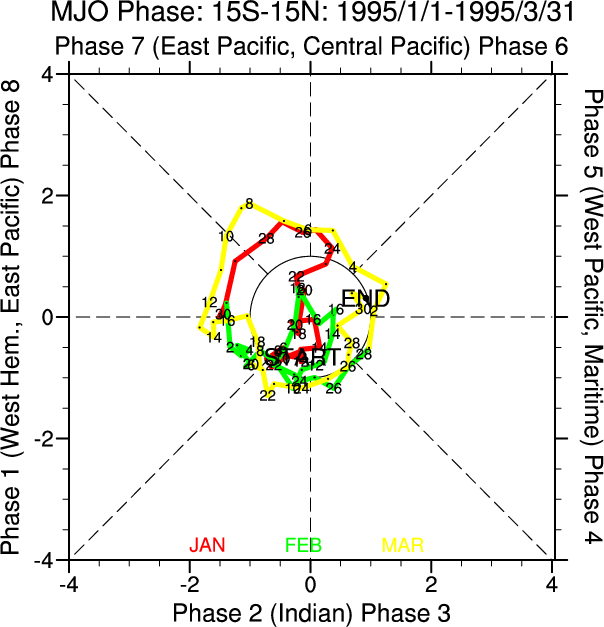
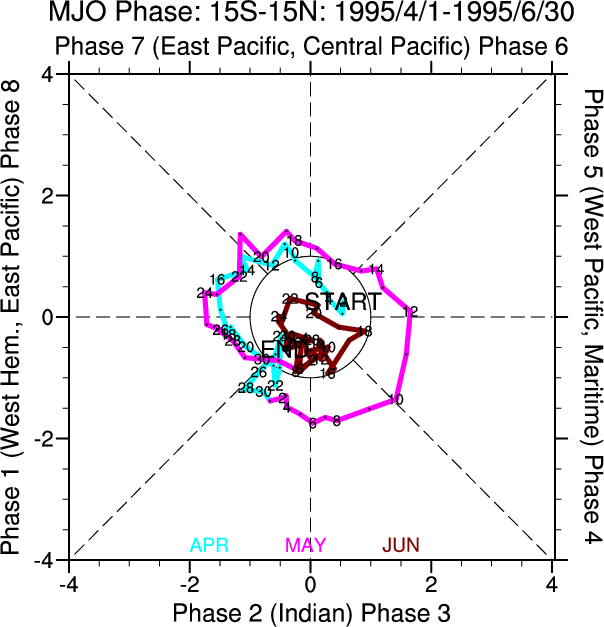
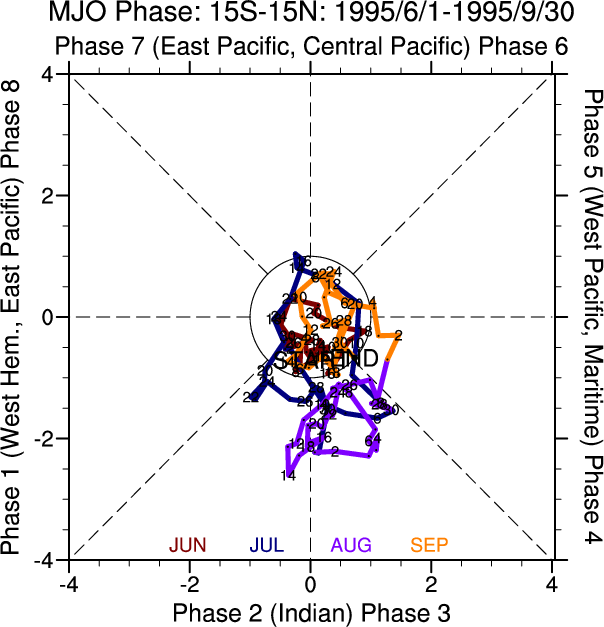
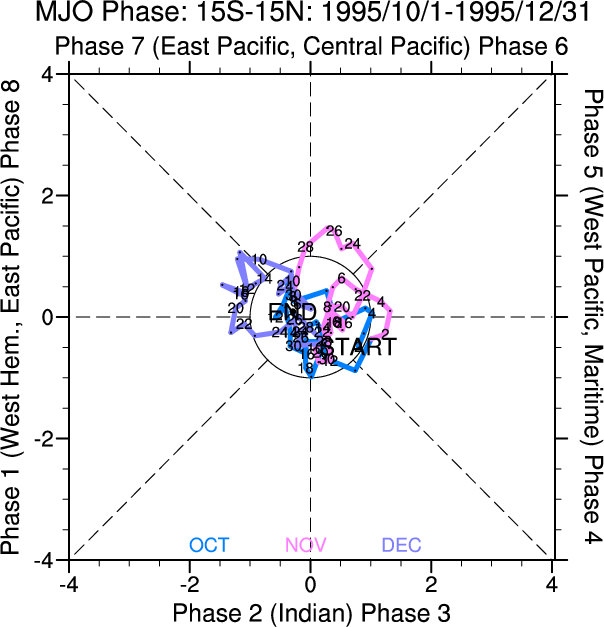
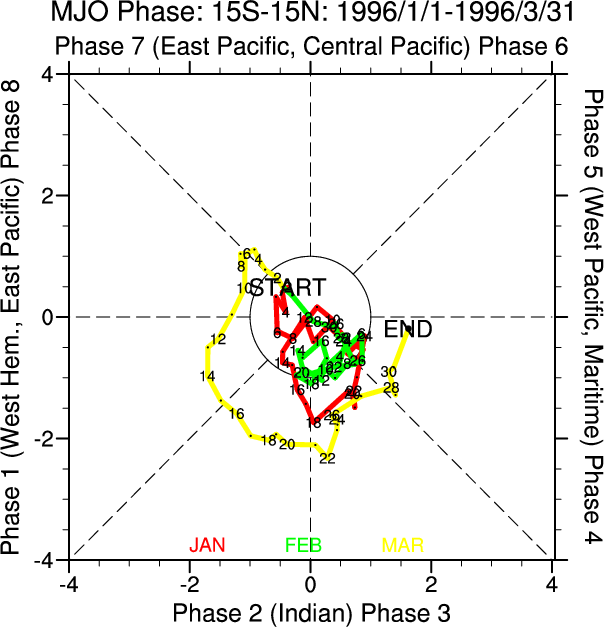
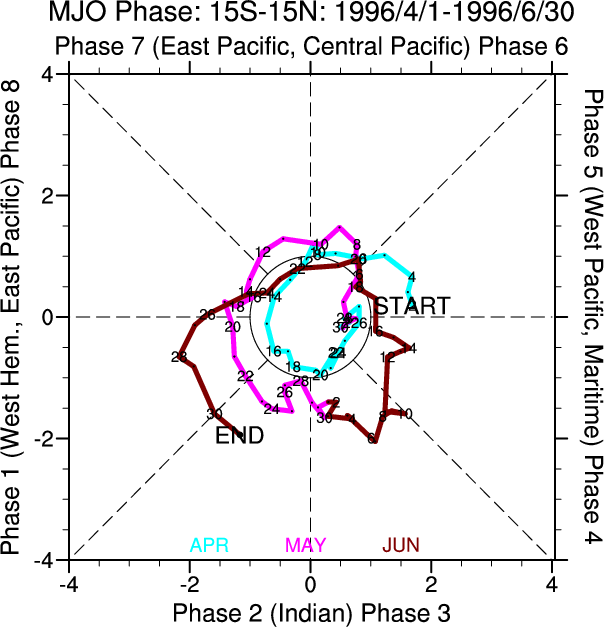
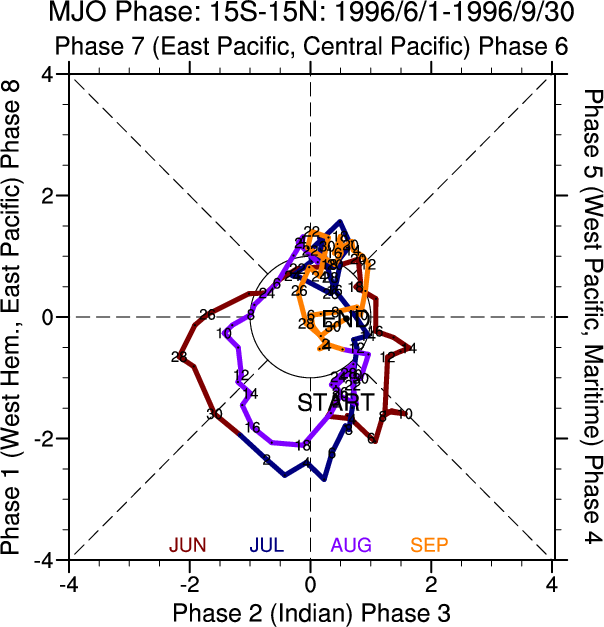
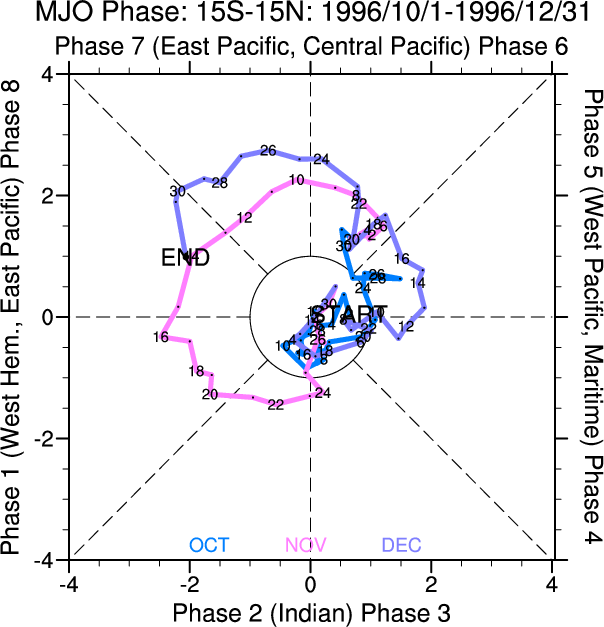
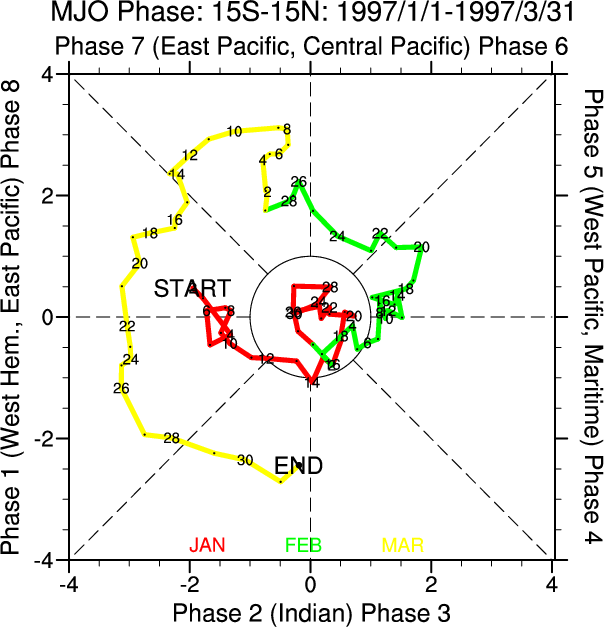
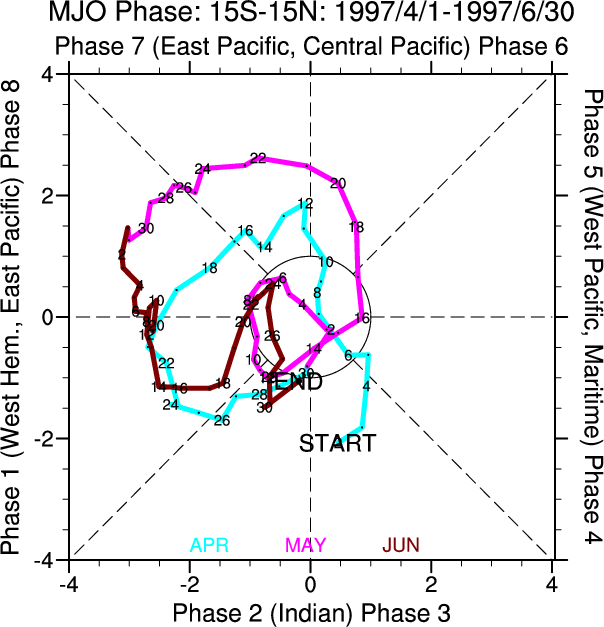
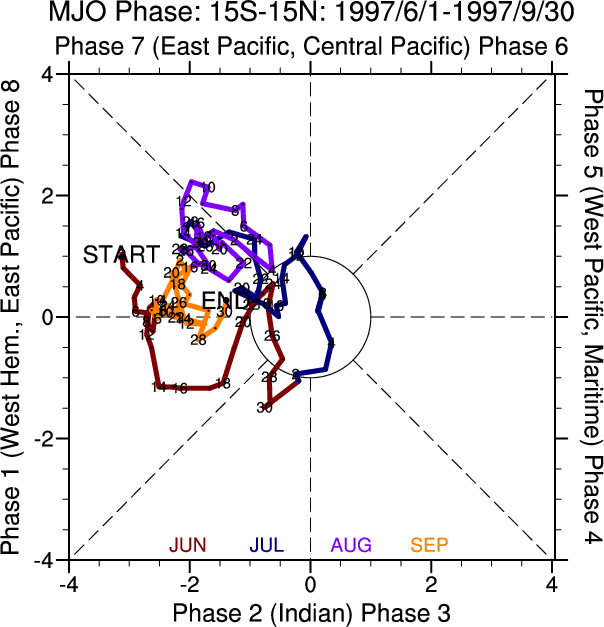
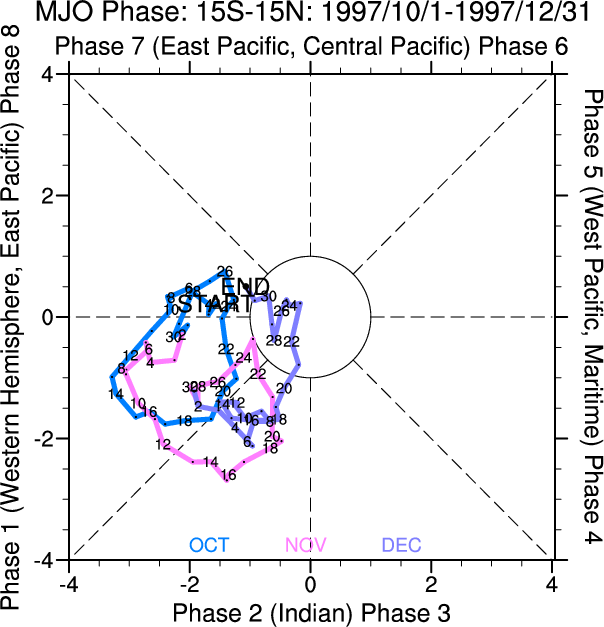
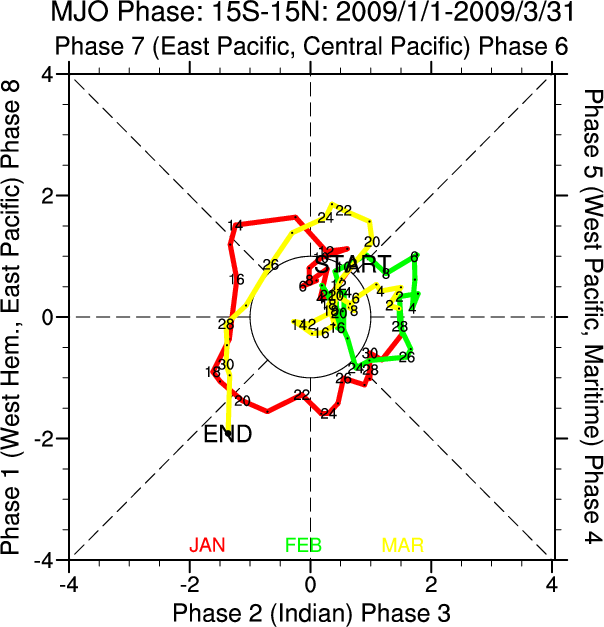
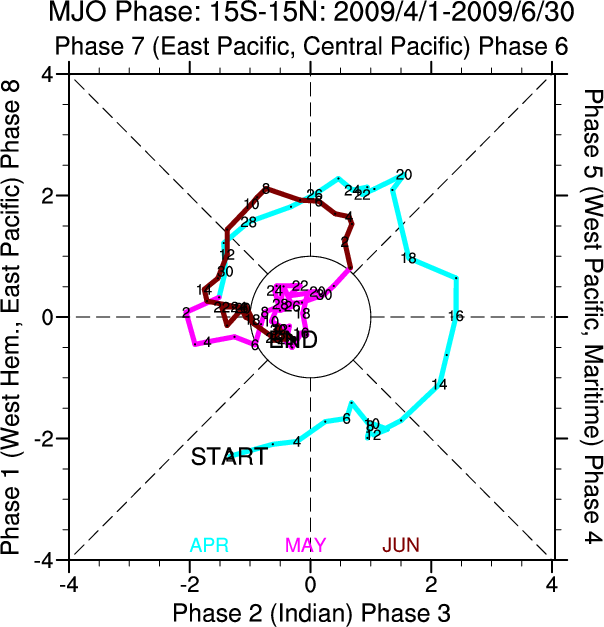
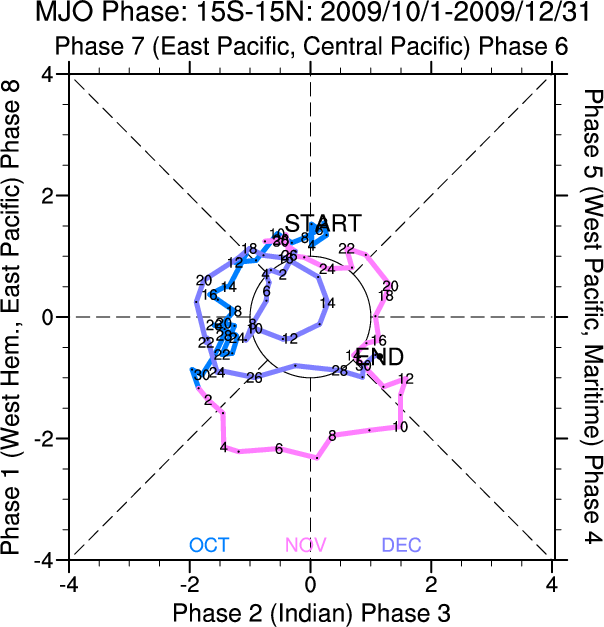
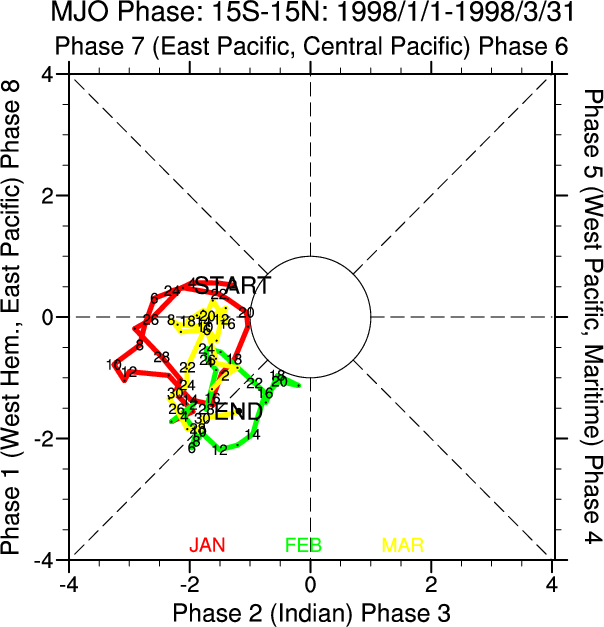
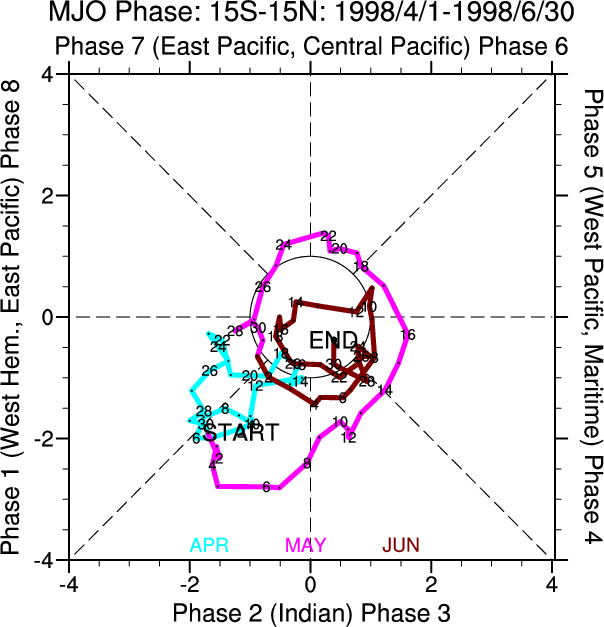
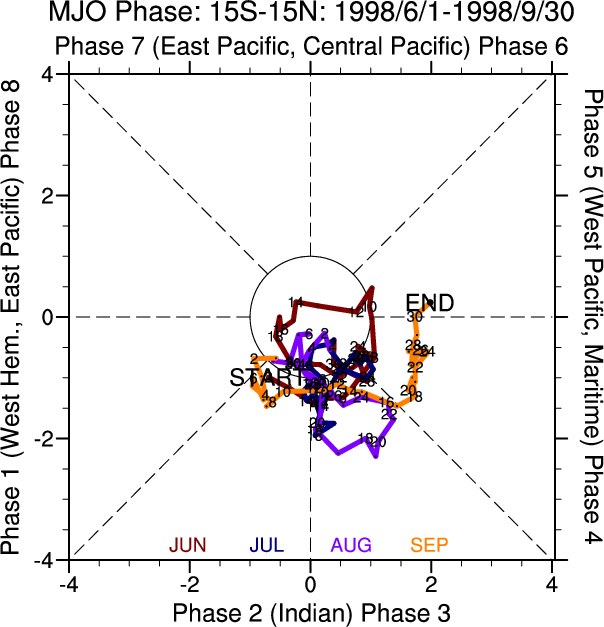
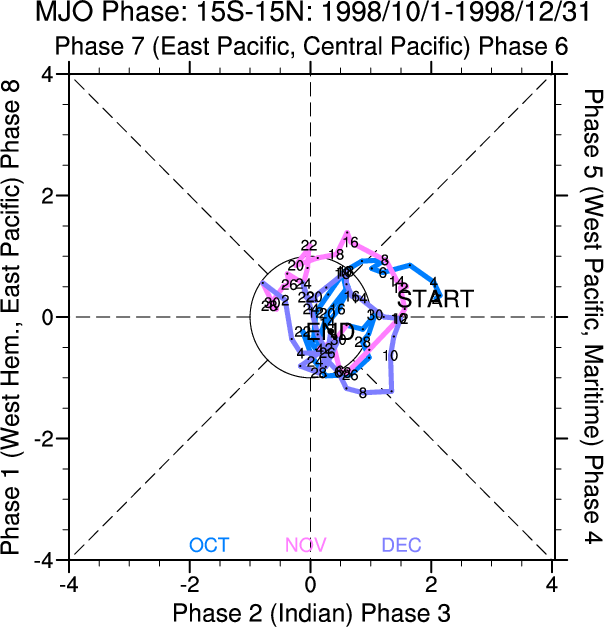
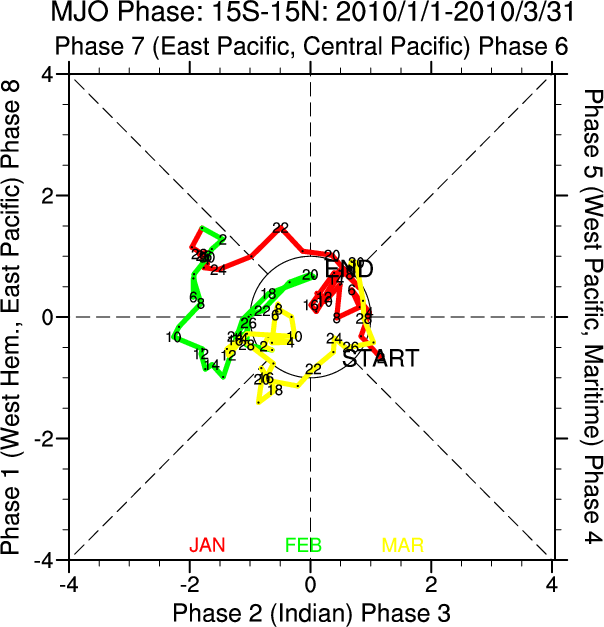
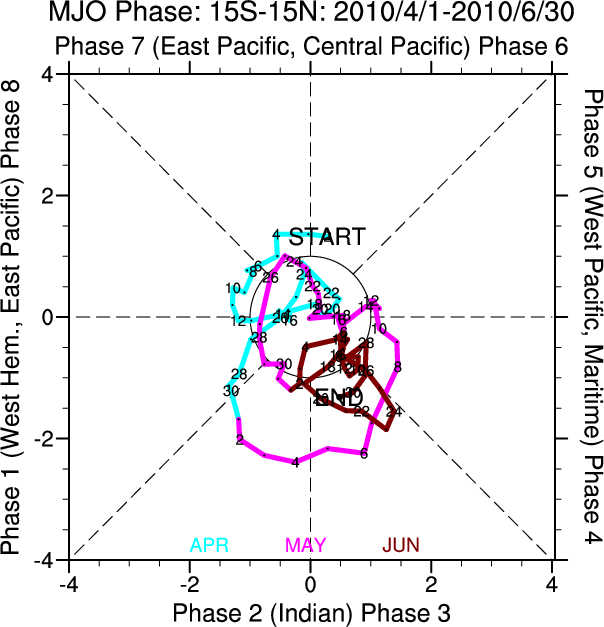
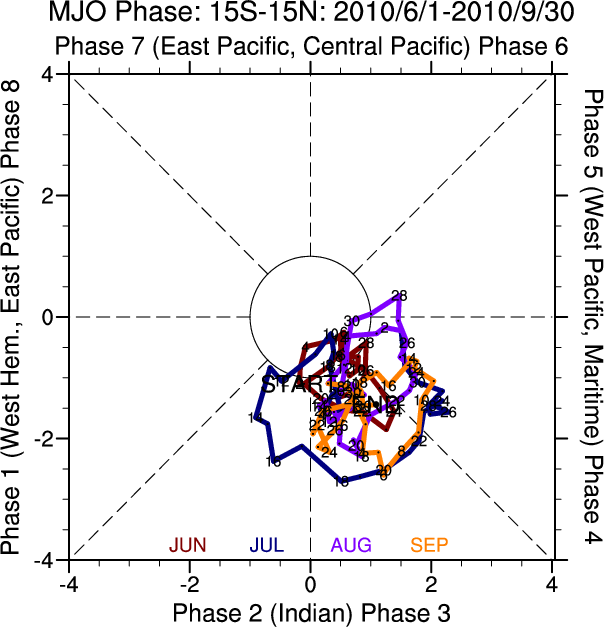
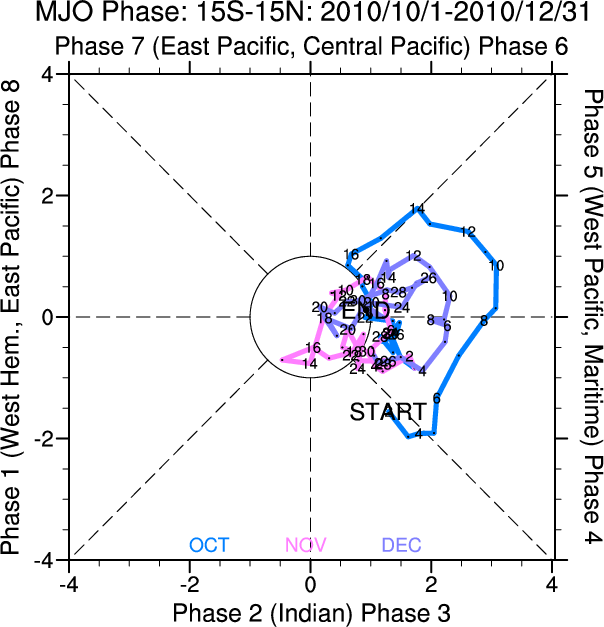
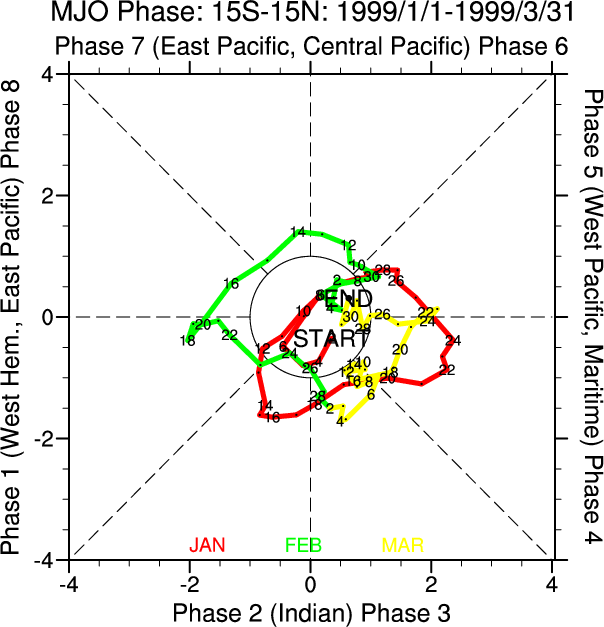
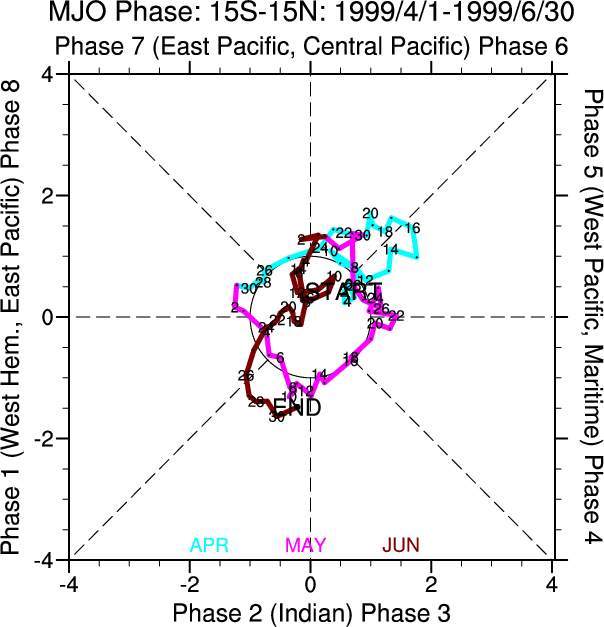
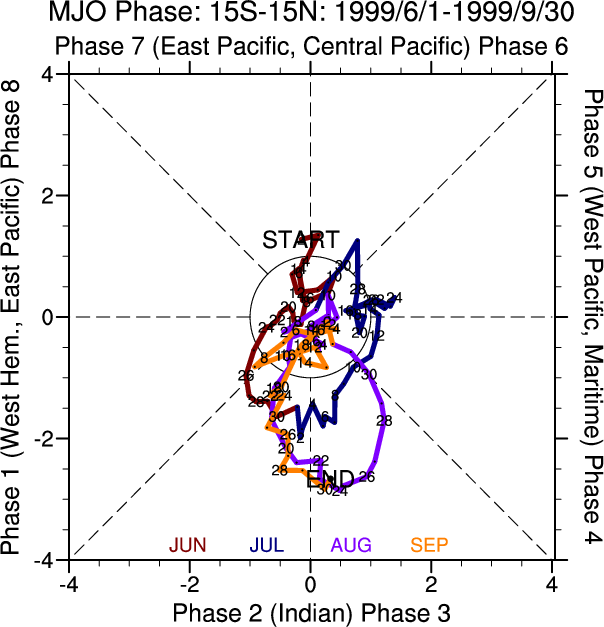
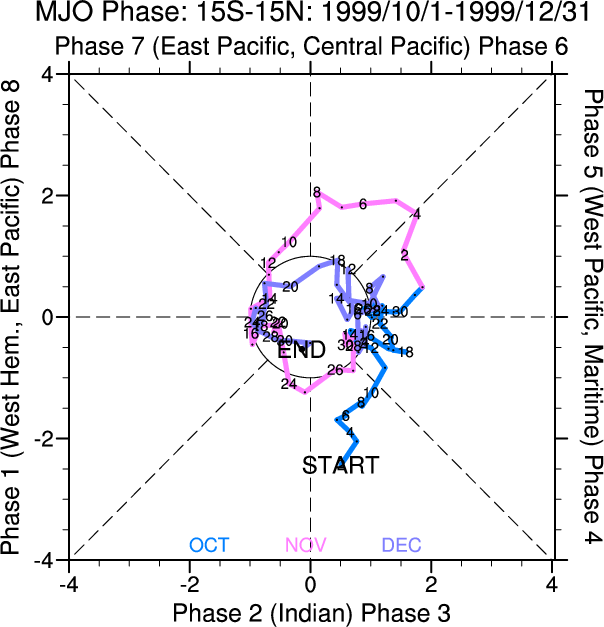
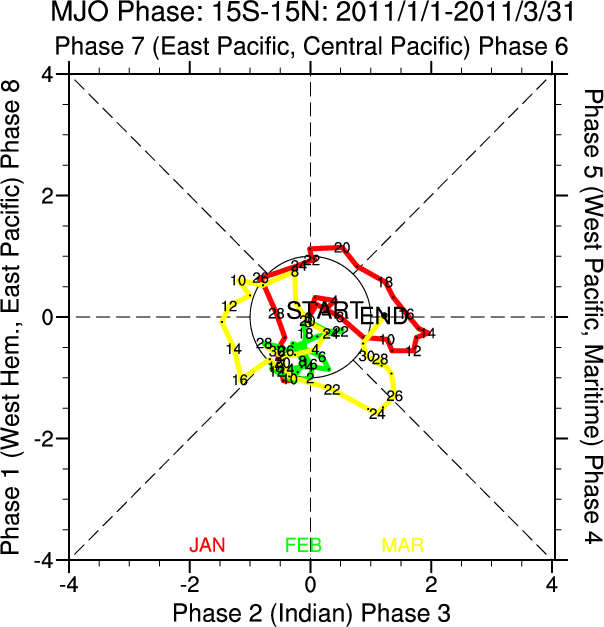
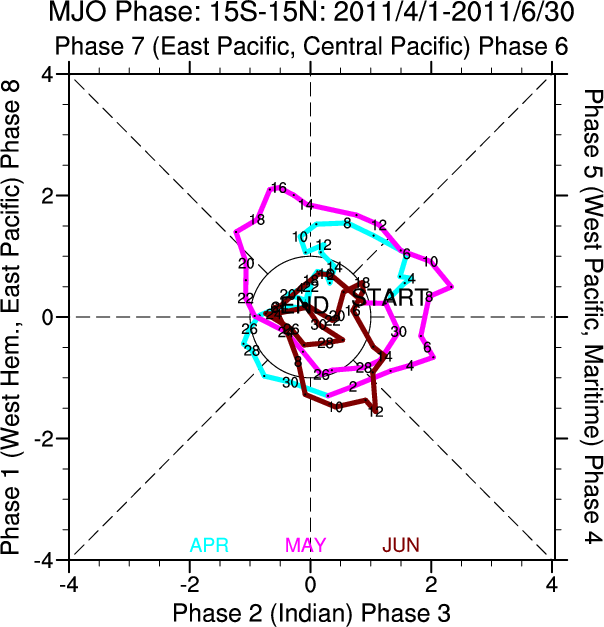
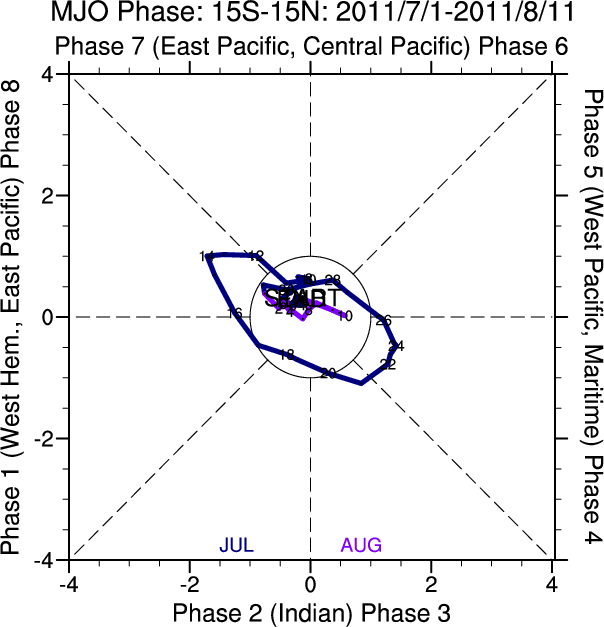
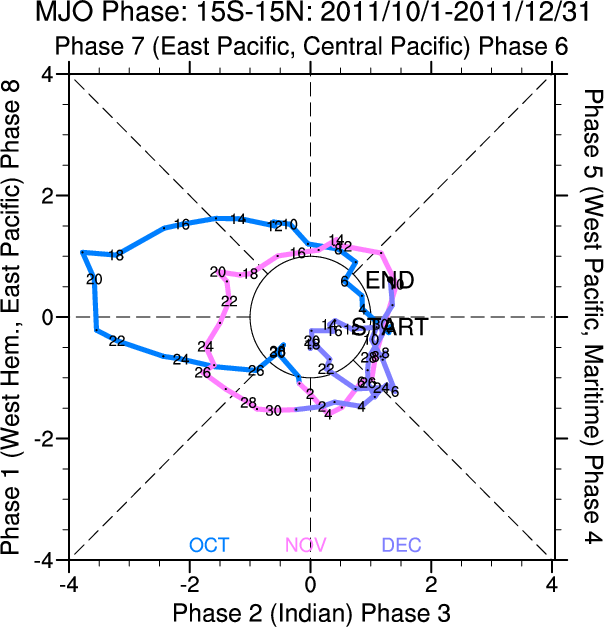
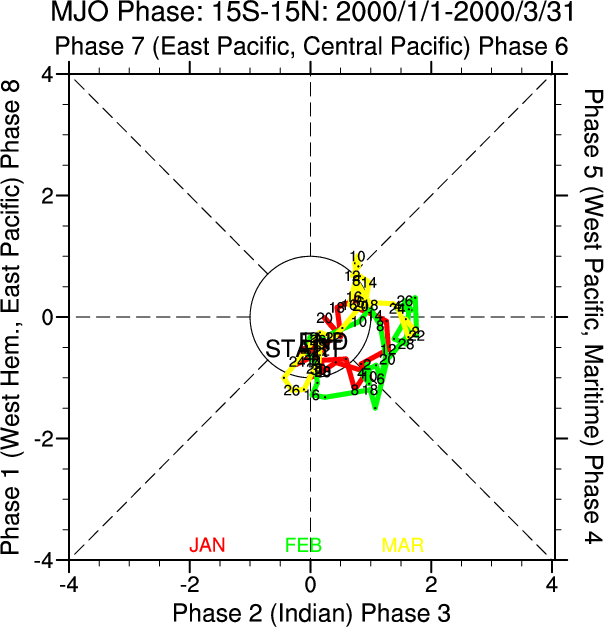
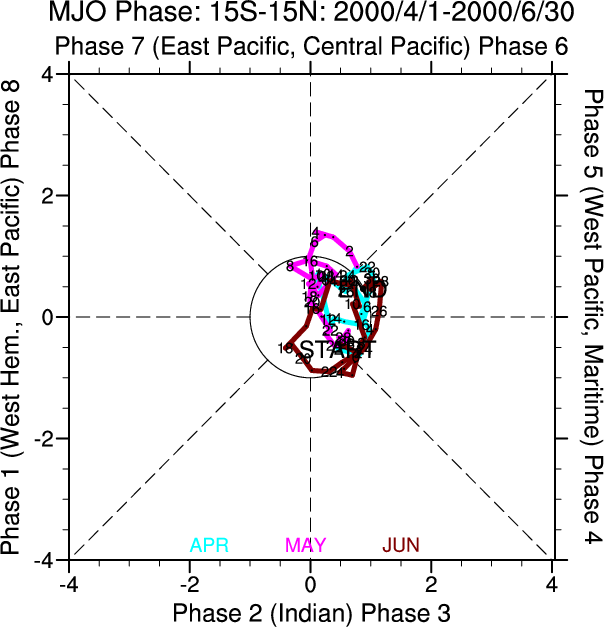
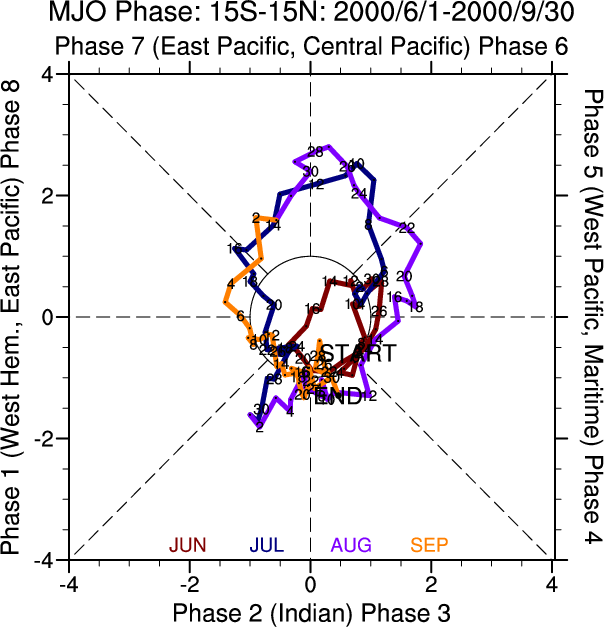
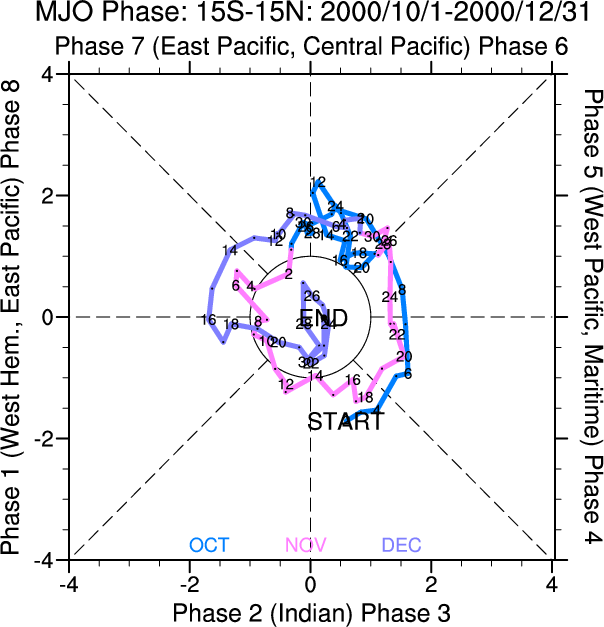
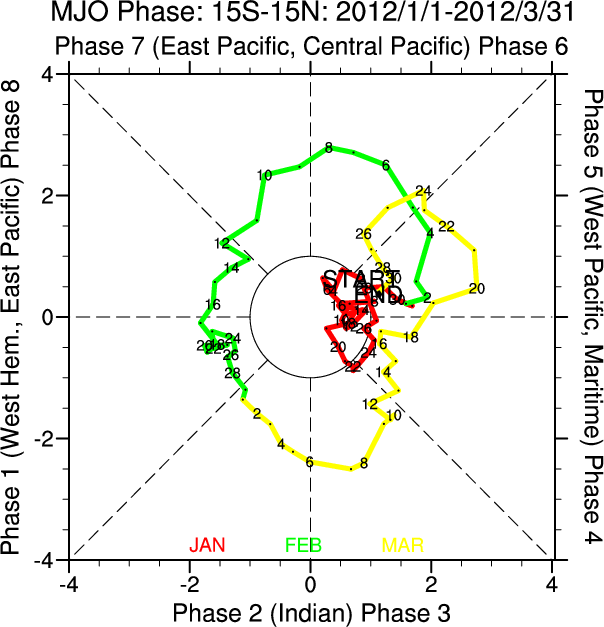
VPM Partial Fraction Phase-Space Diagrams
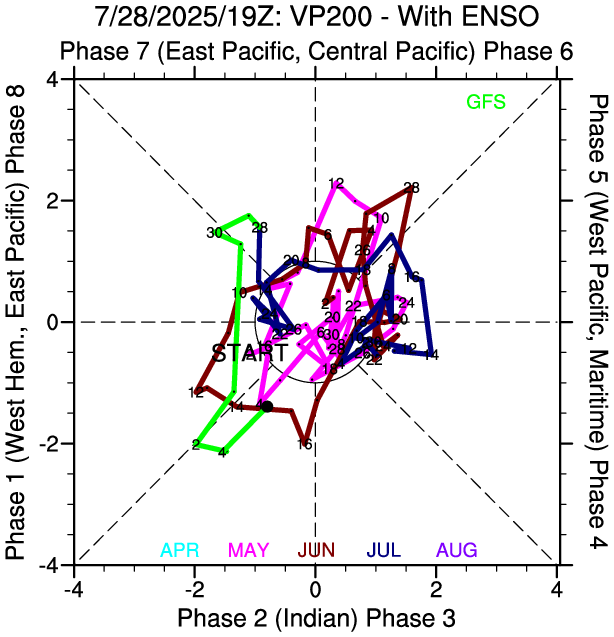
Space-Time MJO Filtered Velocity Potential Phase Space Diagrams
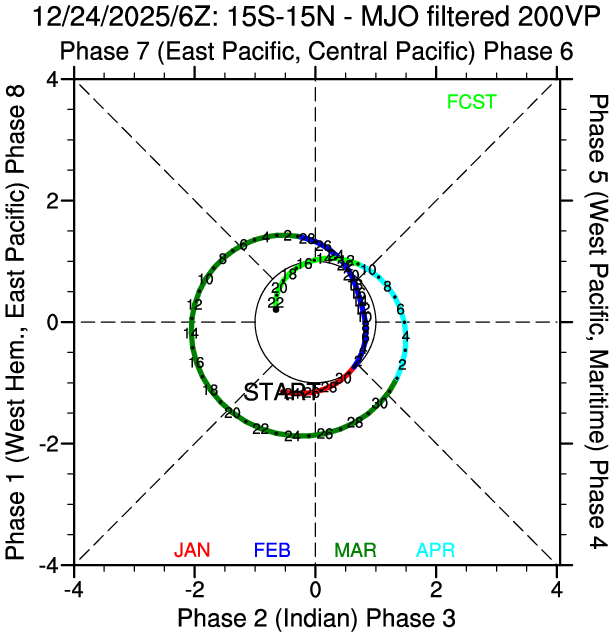
MJO Filtered VP200 anomalies. To see the variance of EOFs 1 and 2 , click here.
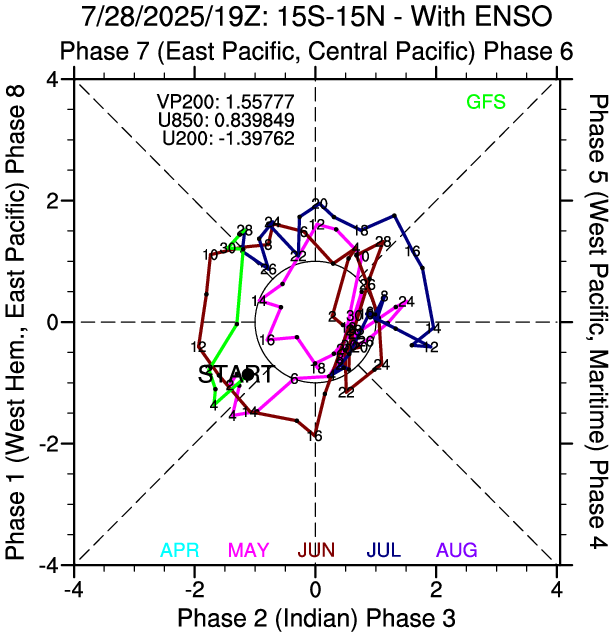
*NEW* 6-Variable Combined MJO Index
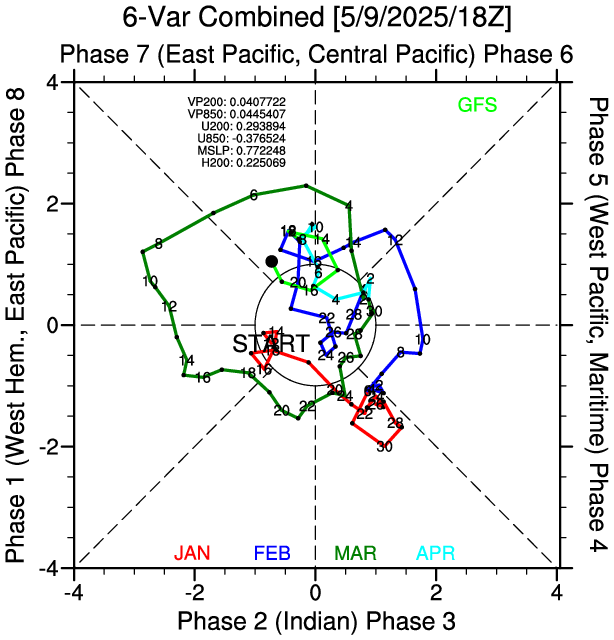
GFS variables used are VP200, VP850, U200, U850, MSLP, H200 averaged over 15S-15N. The fractional contribution of each component on the full PC is shown in top left. To see the variance of EOFs 1 and 2, click here.
1989-2009 6-Var Climatology (Without ENSO)
1989-2009 Partial Fraction Contribution Climatology (Without ENSO)
1989-2009 6-Var Climatology (Without ENSO)
1989-2009 Partial Fraction Contribution Climatology (Without ENSO)
Unfiltered 850VP and 200VP MJO Index
Global Composites
o 200 hPa velocity potential anomalies (shaded) and 200 hPa wind anomalies (vectors) averaged over each phase of the RMM PCs:
Kelvin Index: July-September
VPM without ENSO: June-September
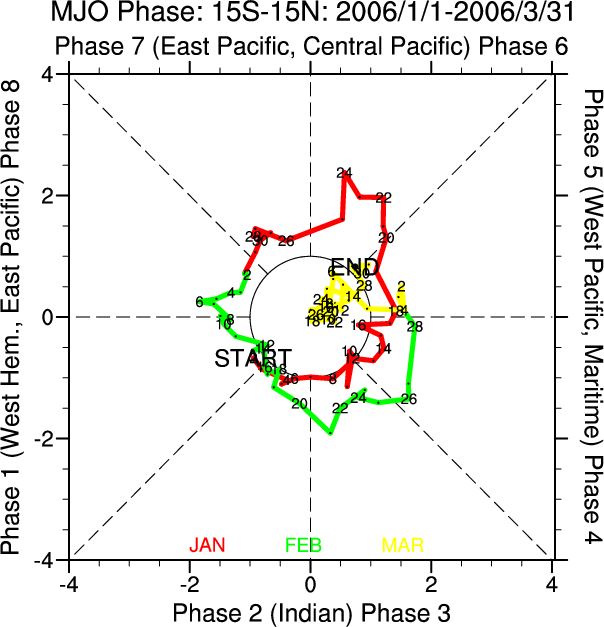
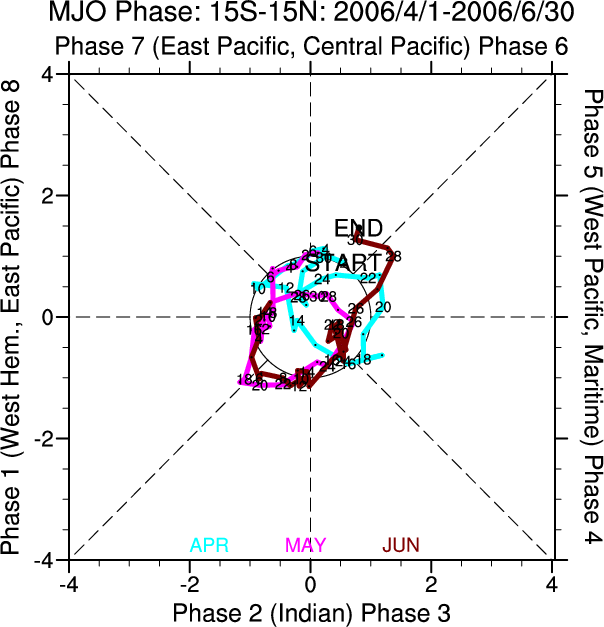
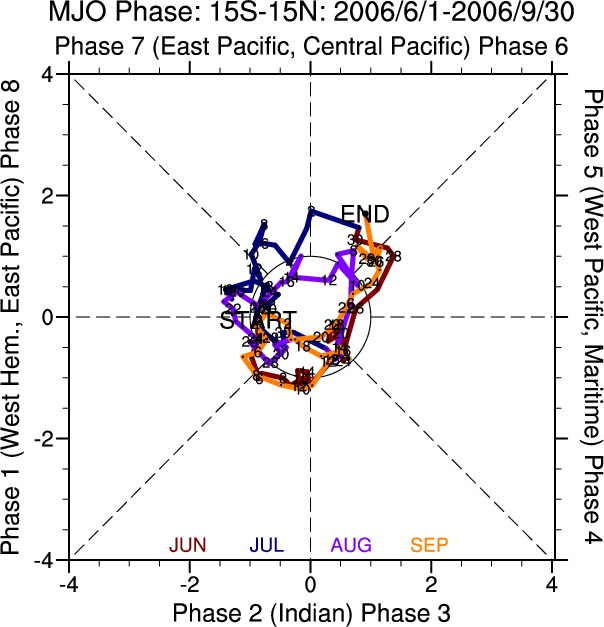
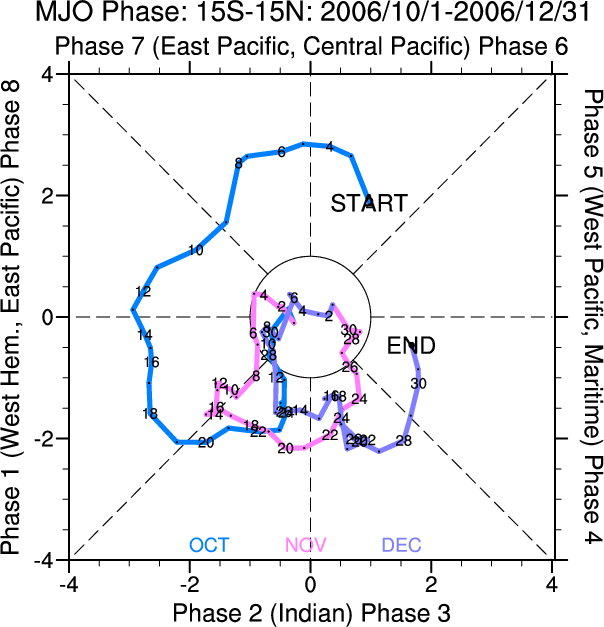
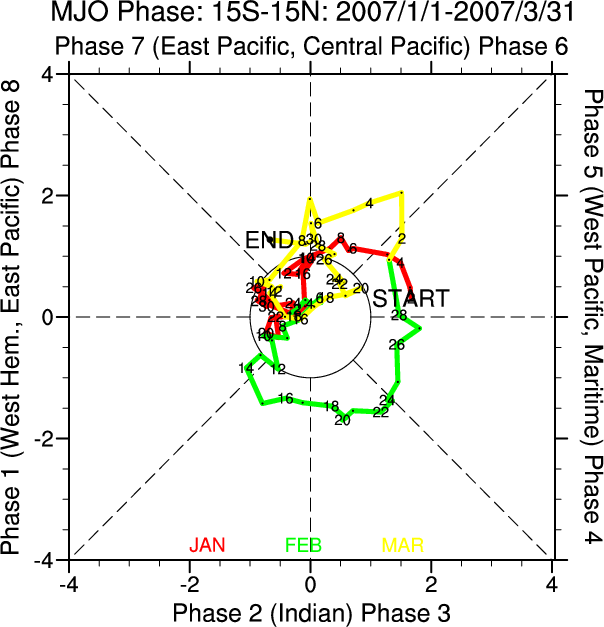
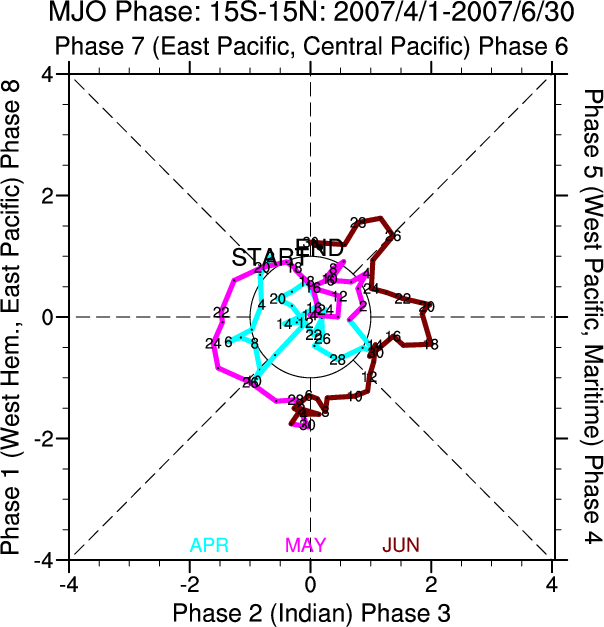
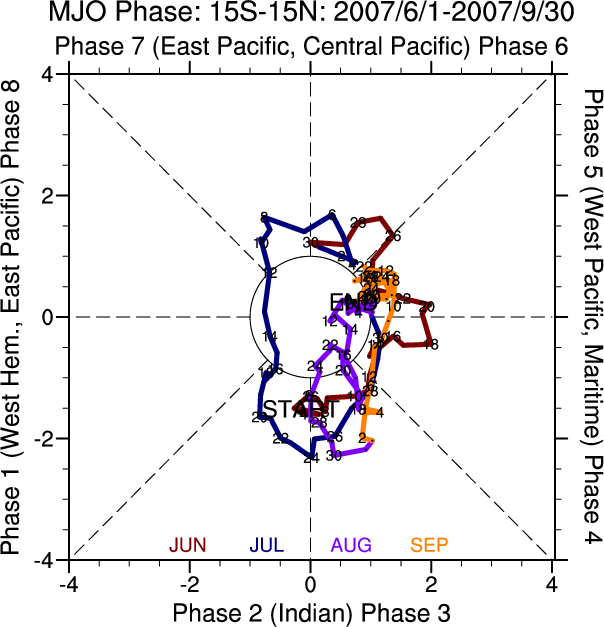
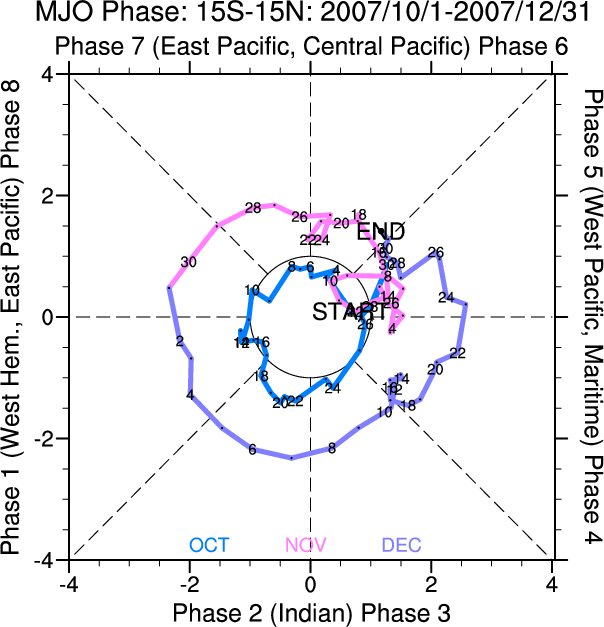
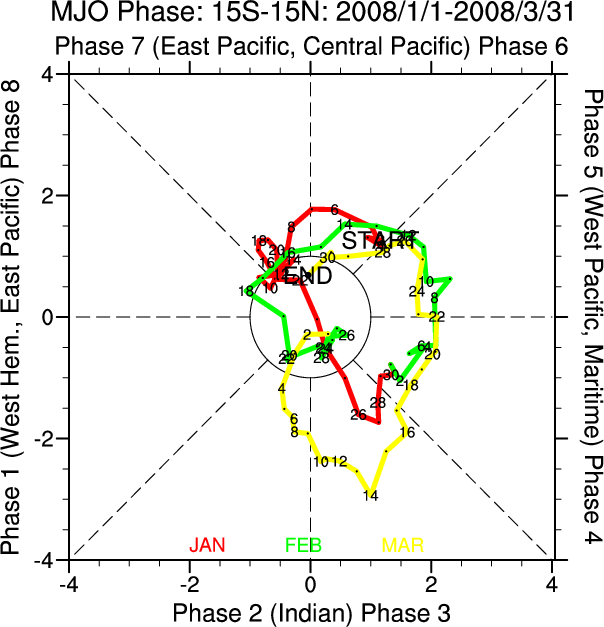
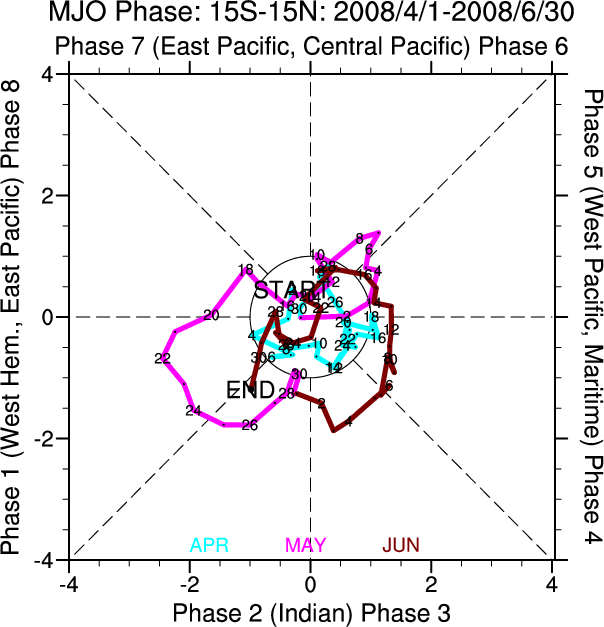
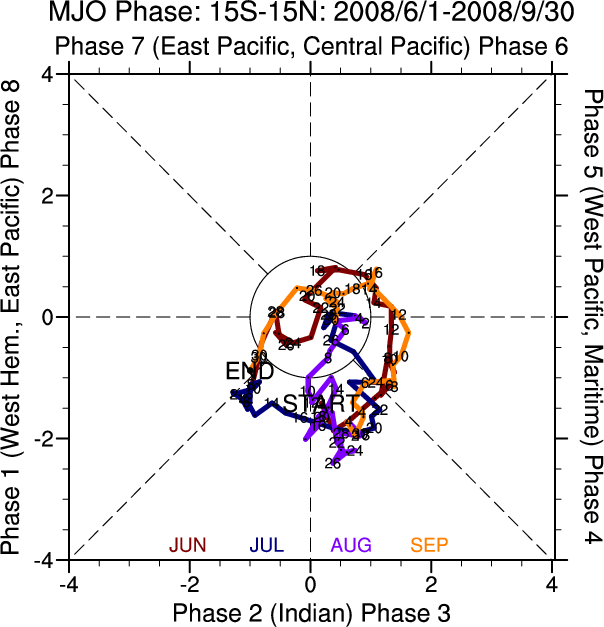
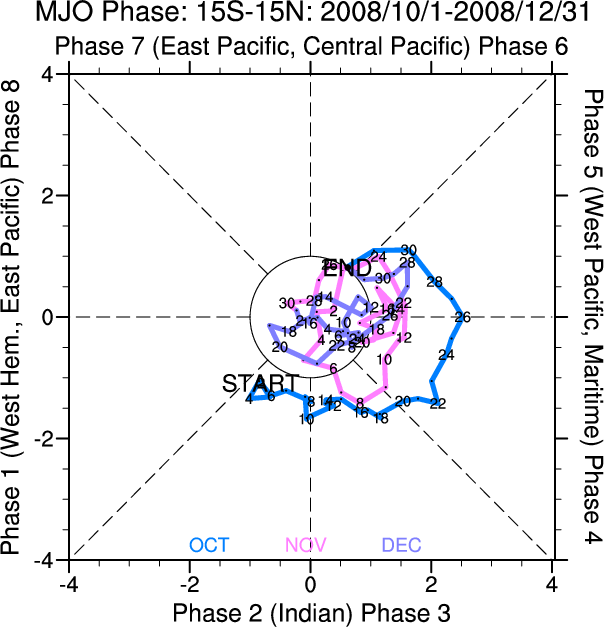
Archive of VPM with ENSO included RMM PCs:
1989: JFM AMJ JAS OND 2001: JFM AMJ JAS OND
1990: JFM AMJ JAS OND 2002: JFM AMJ JAS OND
1991: JFM AMJ JAS OND 2003: JFM AMJ JAS OND
1992: JFM AMJ JAS OND 2004: JFM AMJ JAS OND
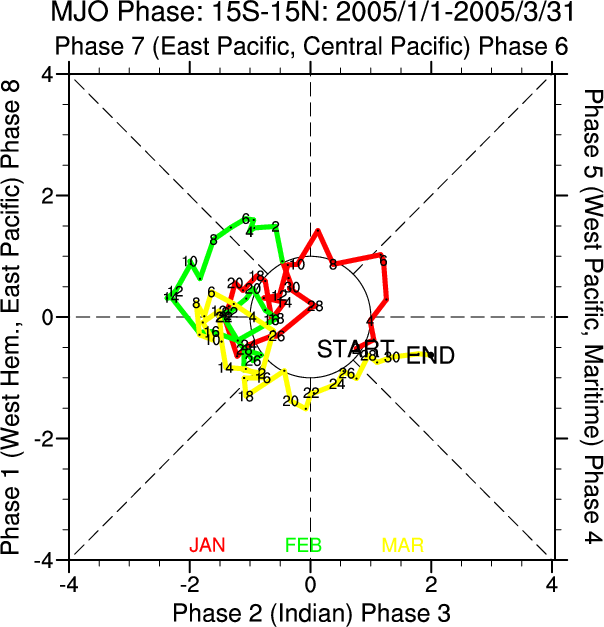
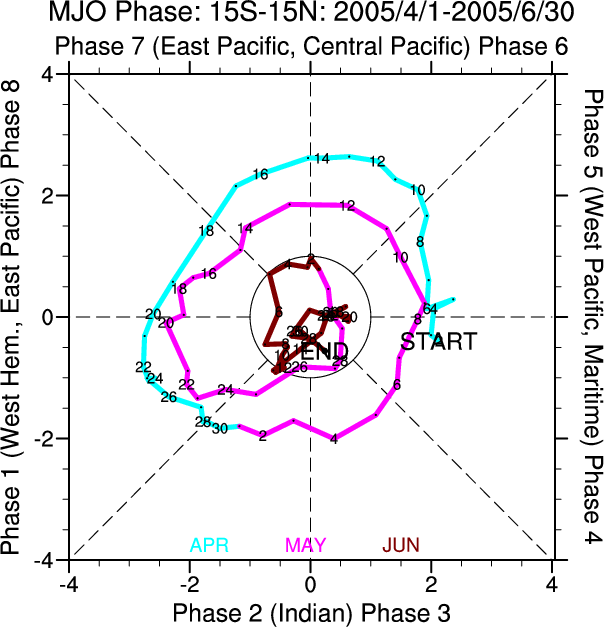
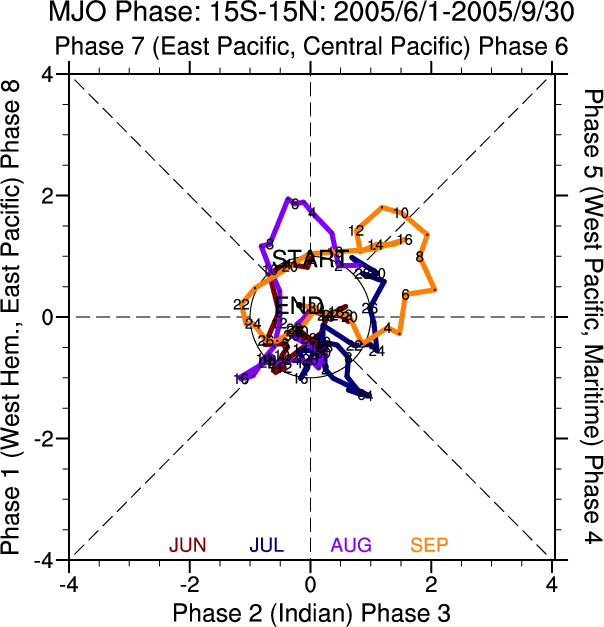
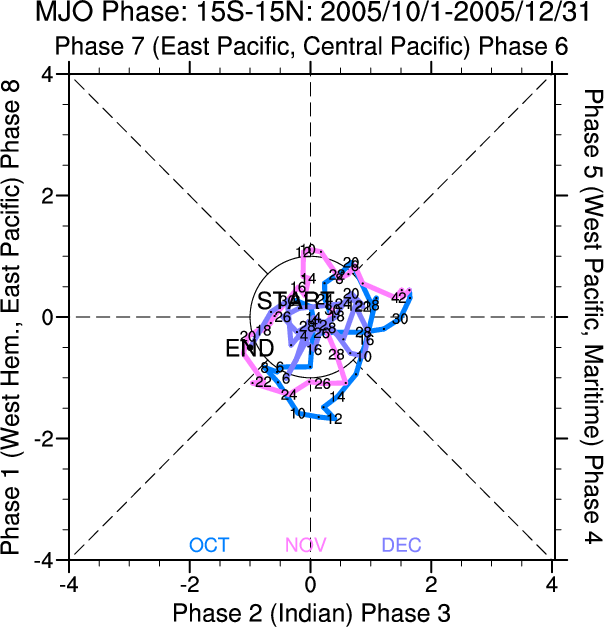
1993: JFM AMJ JAS OND 2005: JFM AMJ JAS OND
1994: JFM AMJ JAS OND 2006: JFM AMJ JAS OND
1995: JFM AMJ JAS OND 2007: JFM AMJ JAS OND
1996: JFM AMJ JAS OND 2008: JFM AMJ JAS OND
1997: JFM AMJ JAS OND 2009: JFM AMJ JAS OND
1998: JFM AMJ JAS OND 2010: JFM AMJ JAS OND
1999: JFM AMJ JAS OND 2011: JFM AMJ JAS OND
2000: JFM AMJ JAS OND 2012: JFM AMJ JAS OND
Kelvin Index: July-September
VPM without ENSO: June-September
Archive of VPM with ENSO included RMM PCs:
1989: JFM AMJ JAS OND 2001: JFM AMJ JAS OND
1990: JFM AMJ JAS OND 2002: JFM AMJ JAS OND
1991: JFM AMJ JAS OND 2003: JFM AMJ JAS OND
1992: JFM AMJ JAS OND 2004: JFM AMJ JAS OND
1993: JFM AMJ JAS OND 2005: JFM AMJ JAS OND
1994: JFM AMJ JAS OND 2006: JFM AMJ JAS OND
1995: JFM AMJ JAS OND 2007: JFM AMJ JAS OND
1996: JFM AMJ JAS OND 2008: JFM AMJ JAS OND
1997: JFM AMJ JAS OND 2009: JFM AMJ JAS OND
1998: JFM AMJ JAS OND 2010: JFM AMJ JAS OND
1999: JFM AMJ JAS OND 2011: JFM AMJ JAS OND
2000: JFM AMJ JAS OND 2012: JFM AMJ JAS OND
