Today's CCKW analysis based off Kelvin filtered VP200 using the 1.0 degree GFS
LOOP THIS IMAGE
Current snapshot of Atlantic Kelvin filtered 200 hPa Velocity Potential anomalies (shading + contours) and 200 hPa wind anomalies (vectors)
Kelvin Filtered 200 hPa VP anomalies are between +/-2 to +/-9 VPUs. Negative (Positive) Kelvin filtered 200 hPa VP anomalies are cold (warm) colored contours, representing upper-level divergence (convergence). For a 90 day time-longitude plot: Click Here
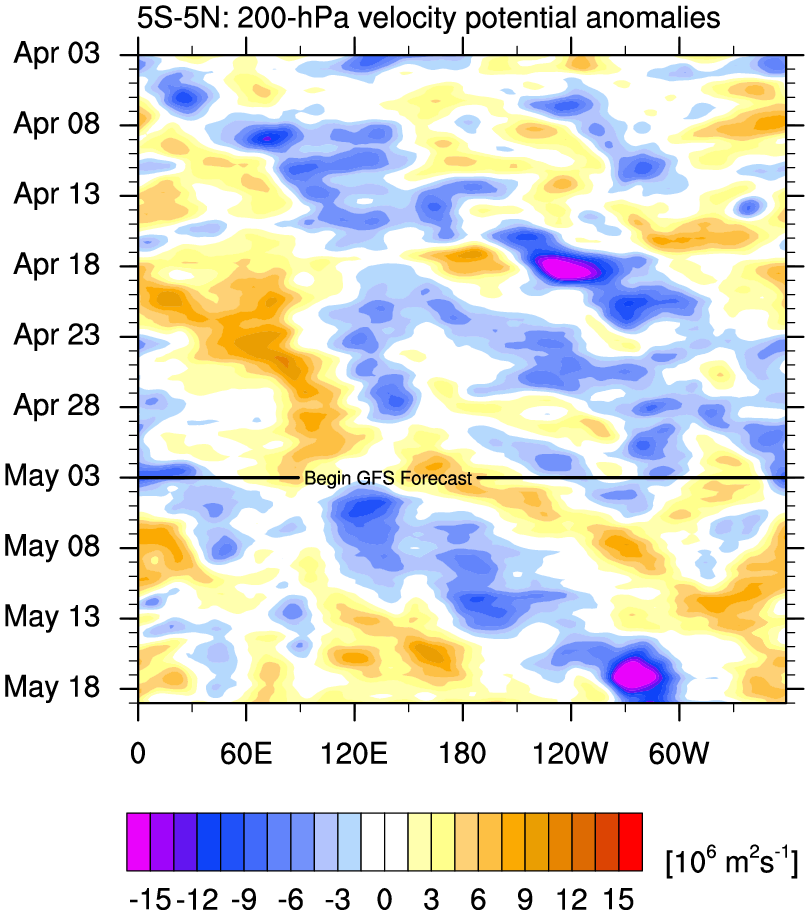
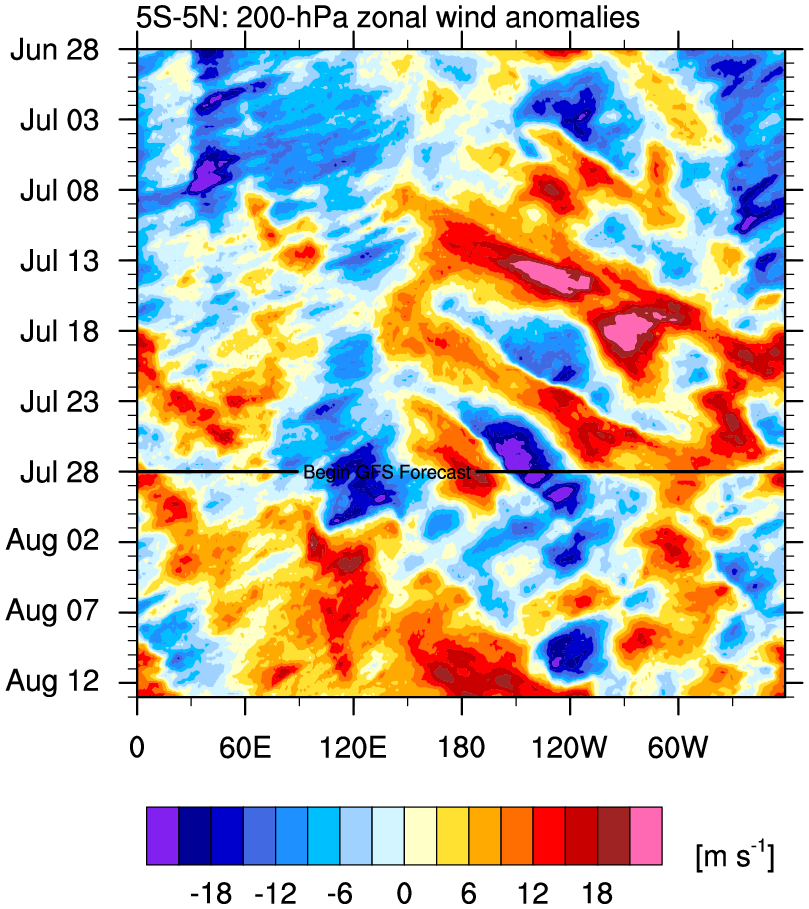
Kelvin filtered (Left) 200 hPa Velocity Potential and (Right) 200 hPa zonal wind anomalies
Convectively suppressed phase of the Kelvin wave: RED contours
Convectively active phase of the Kelvin wave: BLUE dashed contours
Kelvin Filtered anomalies are standardized; CINT = 1 STD for VP200 only
For more information of Kelvin filtering methodology, please visit: Tropical-Waves
Convectively suppressed phase of the Kelvin wave: RED contours
Convectively active phase of the Kelvin wave: BLUE dashed contours
Kelvin Filtered anomalies are standardized; CINT = 1 STD for VP200 only
For more information of Kelvin filtering methodology, please visit: Tropical-Waves
MJO analaysis + forecast based off MJO filtered VP200/VP850 using the 1.0 degree GFS
