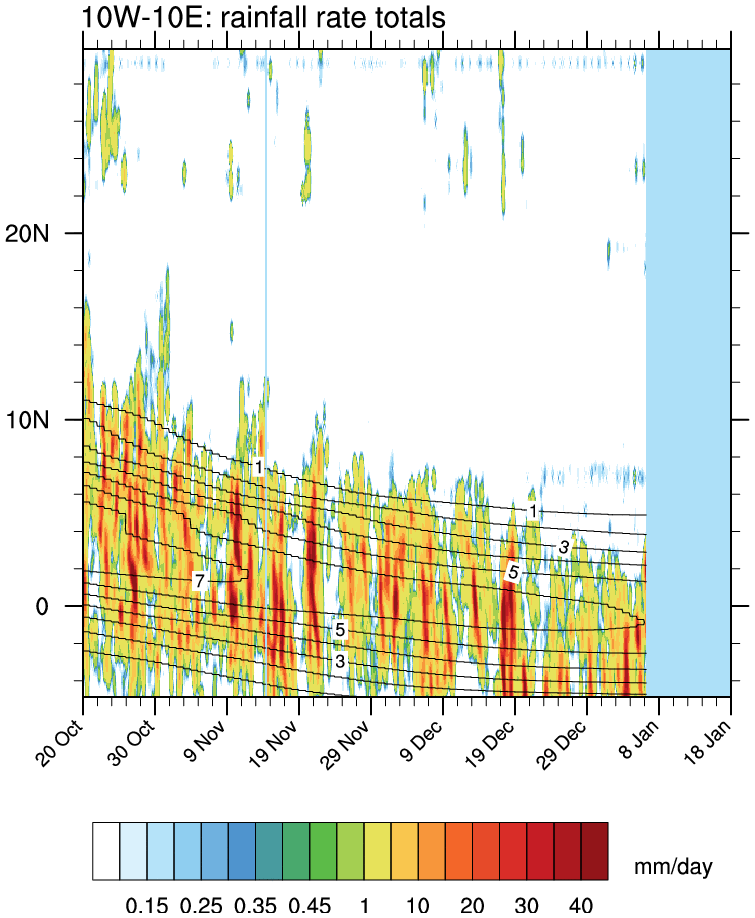
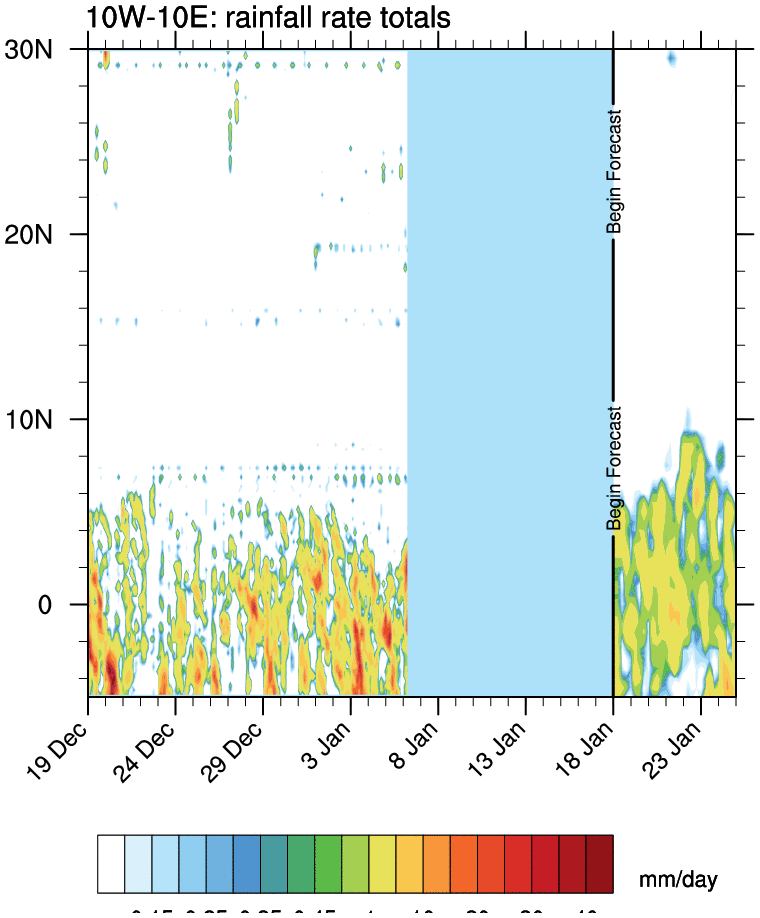
West African Monsoon regional latitude-time rainfall plots
o Latitude–time plots of rainfall for each region, averaged over the indicated longitude band
o Includes TMPA rainfall rates for the last 30 and 90 days and 0.5° GFS forecasts for the next 7 days on the 30 day plot
o Updated daily at 1200 UTC
o Climatological rain rates (mm/day) are contoured on the 90 day plots only.
10°W – 10°E (WAM) 30-Day 90-Day
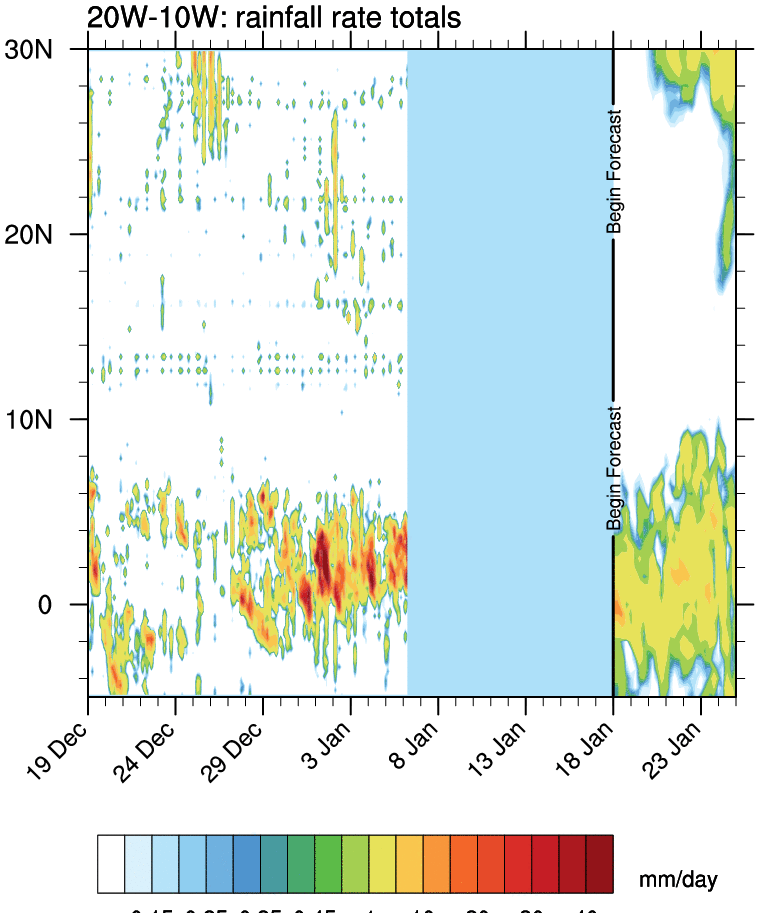
10°W – 20°W (West Sahel) 30-Day 90-Day
o Includes TMPA rainfall rates for the last 30 and 90 days and 0.5° GFS forecasts for the next 7 days on the 30 day plot
o Updated daily at 1200 UTC
o Climatological rain rates (mm/day) are contoured on the 90 day plots only.
10°W – 10°E (WAM) 30-Day 90-Day
10°W – 20°W (West Sahel) 30-Day 90-Day
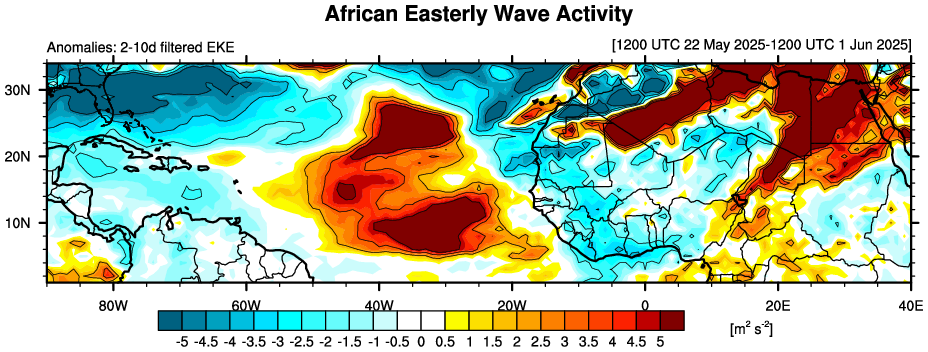
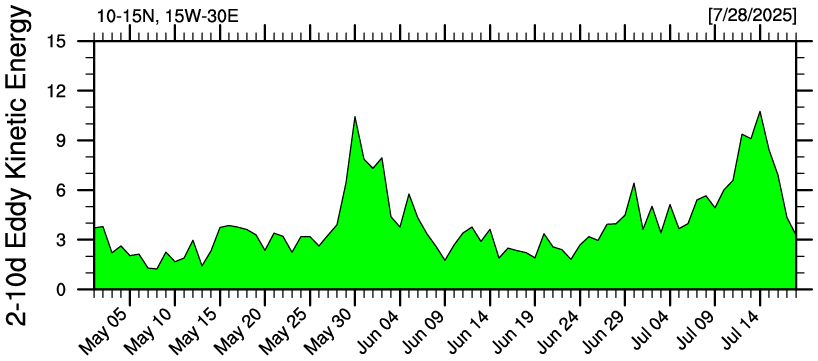
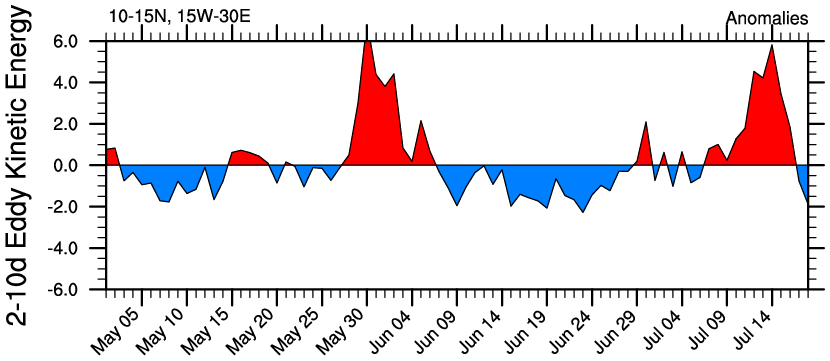
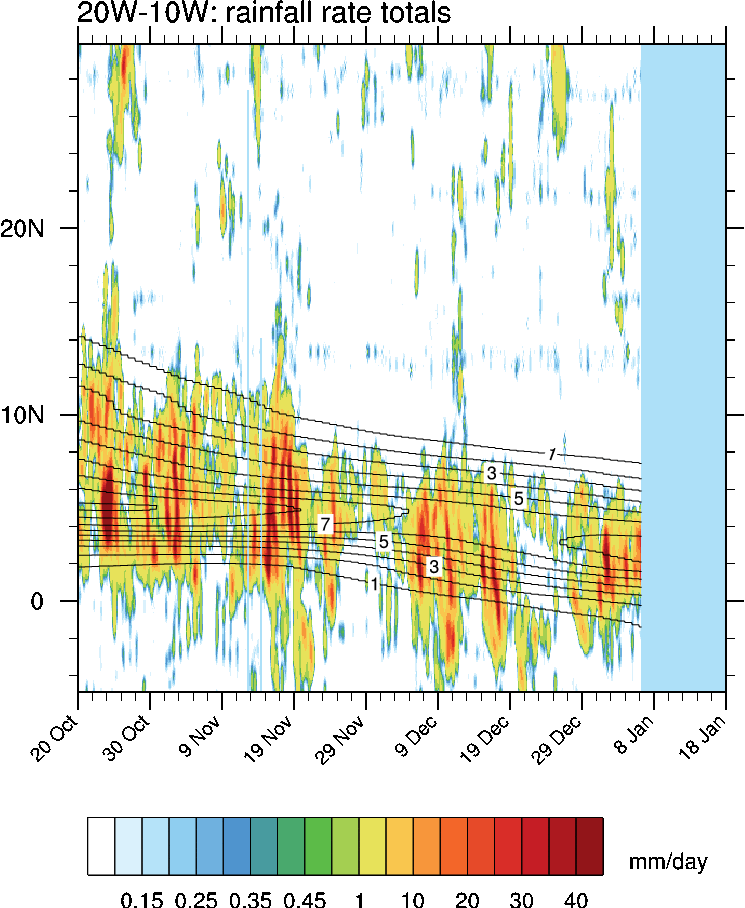
West African Monsoon 2-10d filtered 700 hPa Eddy Kinetic Energy
o Eddy Kinetic Energy (EKE)
o GFS wind data was filtered in time to make u’ and v’
o EKE = ½ (u’² + v’²)
o Anomalies were constructed by removing the long term mean and the first four harmonics
o Ends of both time series were padded with zeros in order to record the most recent date
o GFS wind data was filtered in time to make u’ and v’
o EKE = ½ (u’² + v’²)
o Anomalies were constructed by removing the long term mean and the first four harmonics
o Ends of both time series were padded with zeros in order to record the most recent date
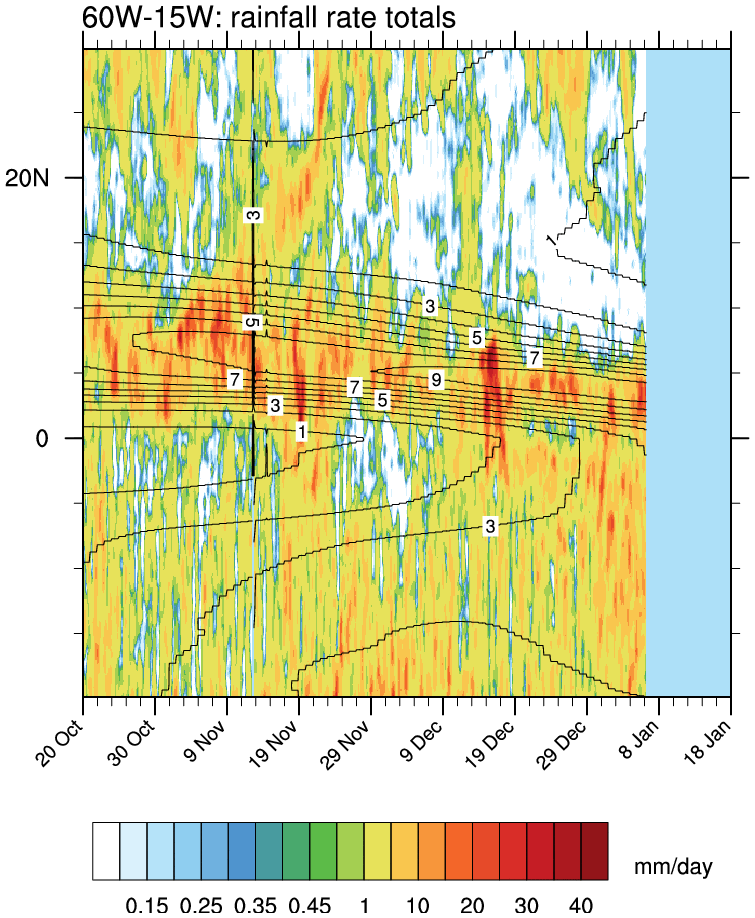
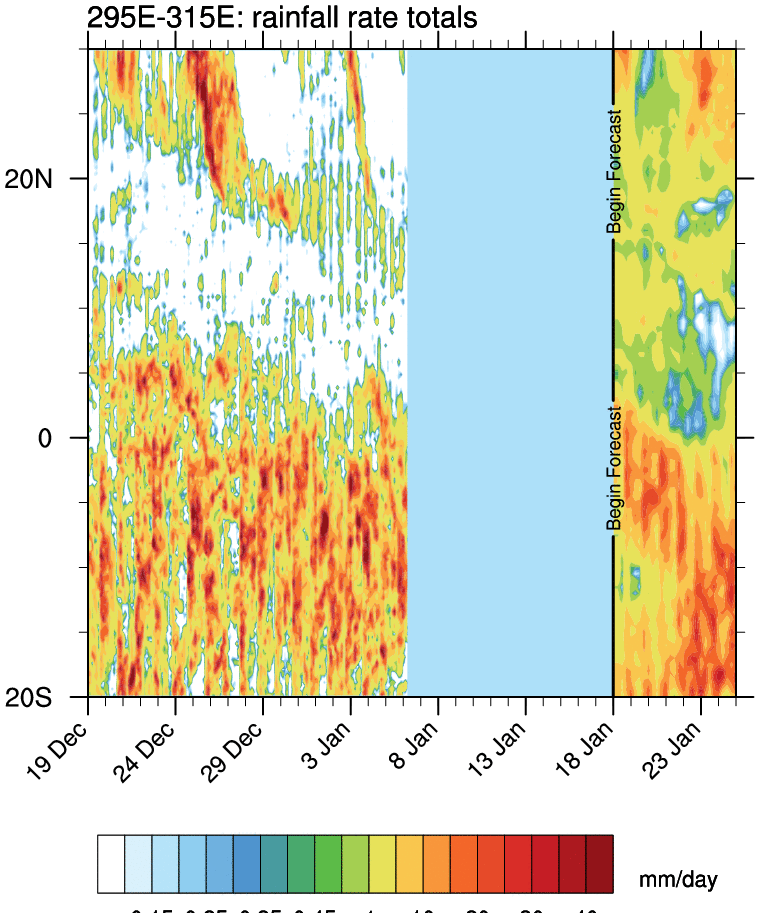
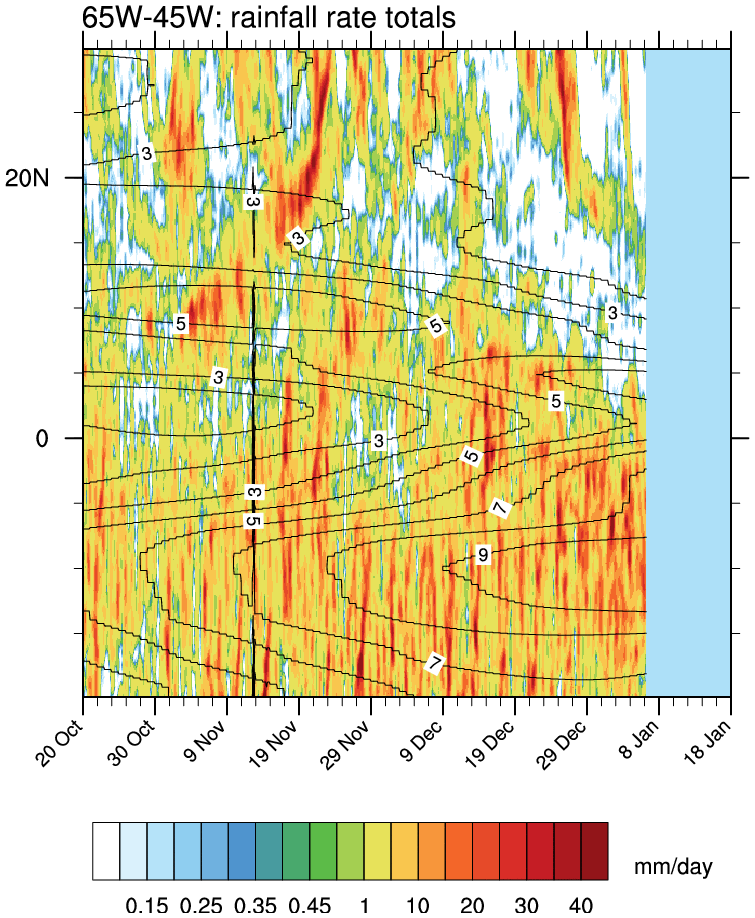
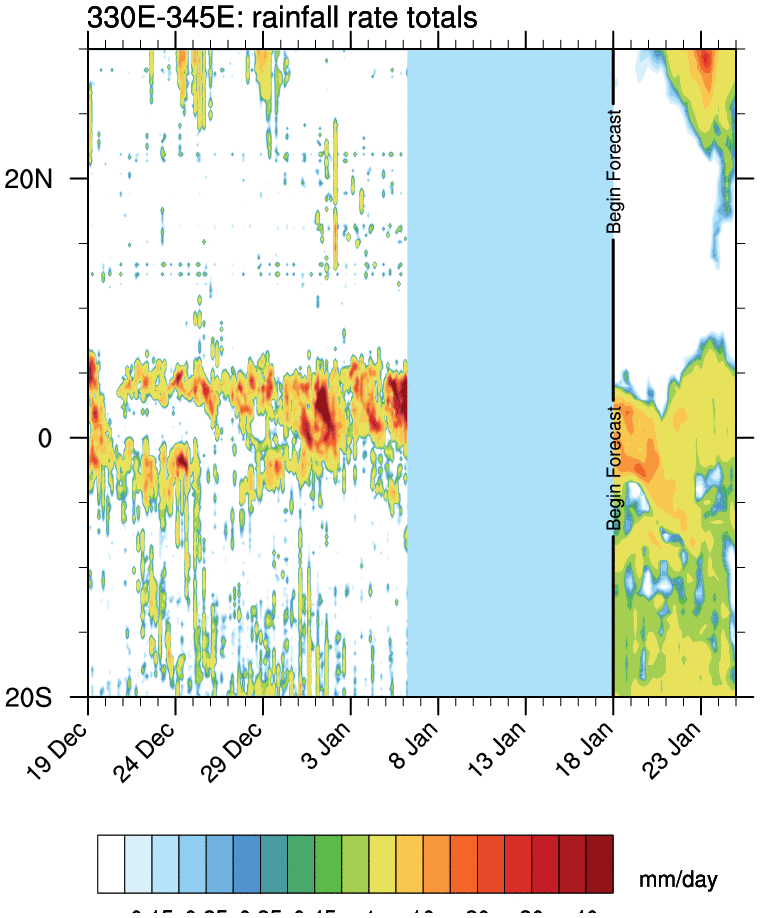
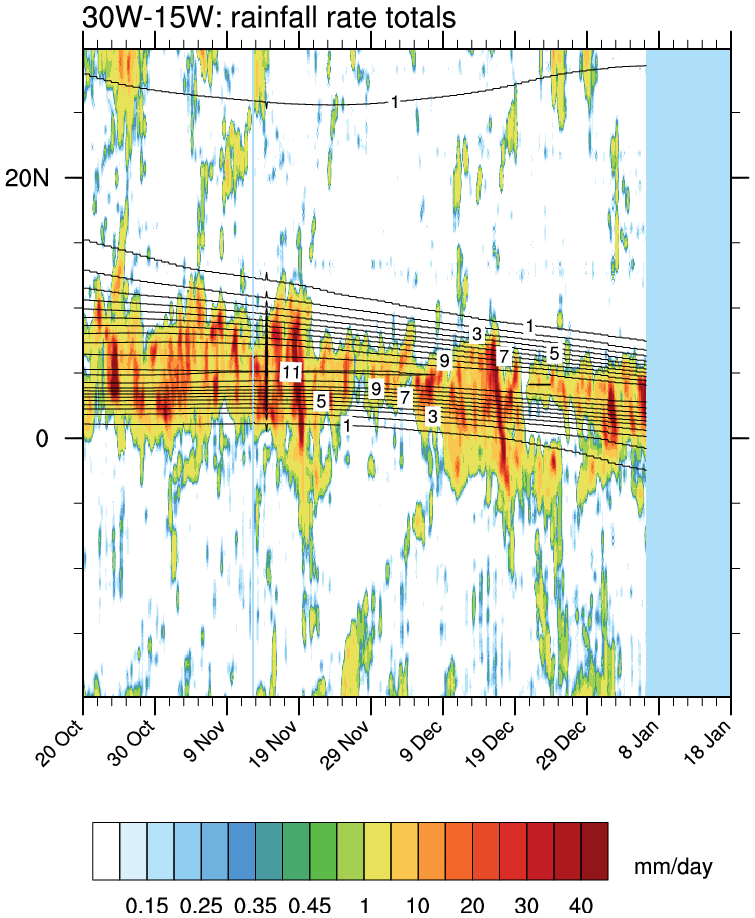
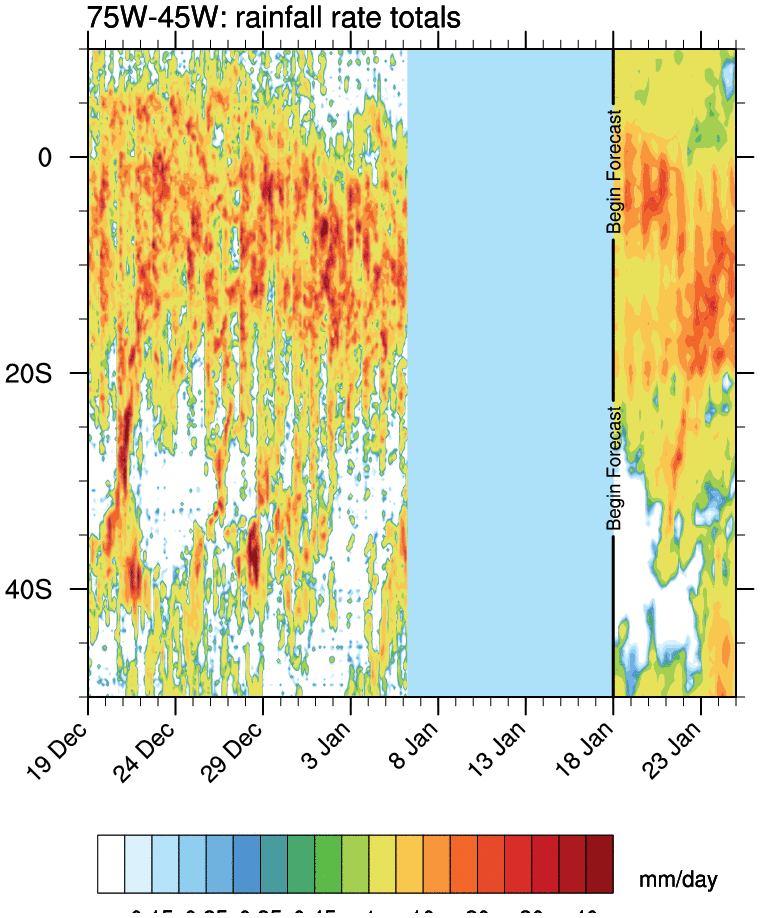
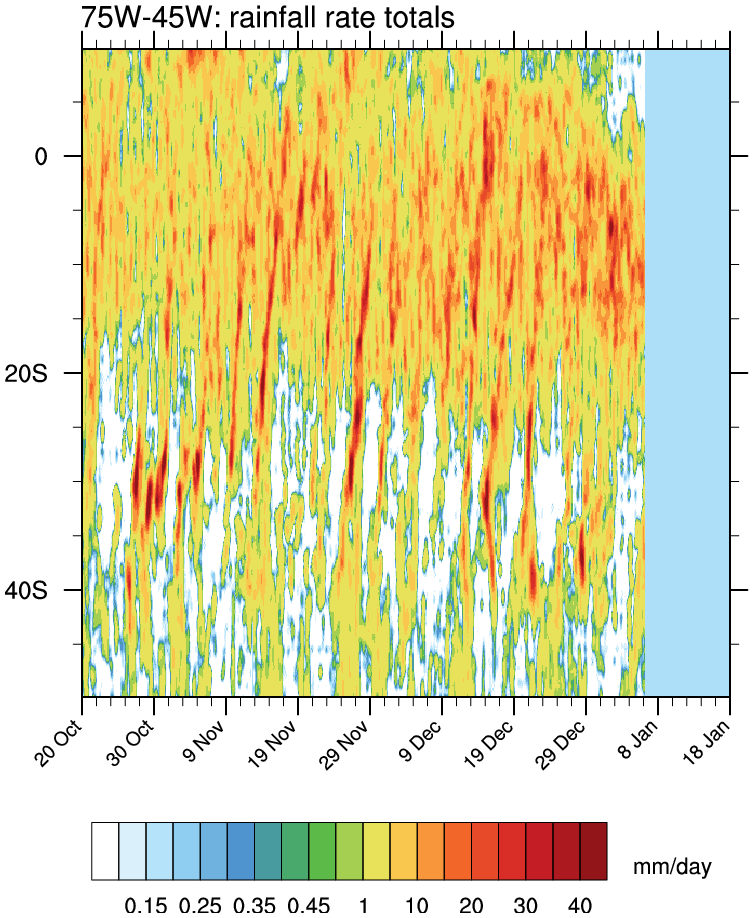
Atlantic ITCZ latitude-time rainfall plots
o Latitude–time plots of rainfall for each region, averaged over the indicated longitude band
o Includes TMPA rainfall rates for the last 30 and 90 days and 0.5° GFS forecasts for the next 7 days on the 30 day plot
o Updated daily at 1200 UTC
o Climatological rain rates (mm/day) are contoured on the 90 day plots only.
15°W – 60°W (Atlantic ITCZ) 30-Day 90-Day
45°W – 65°W (West Atlantic ITCZ) 30-Day 90-Day
15°W – 30°W (East Atlantic ITCZ) 30-Day 90-Day
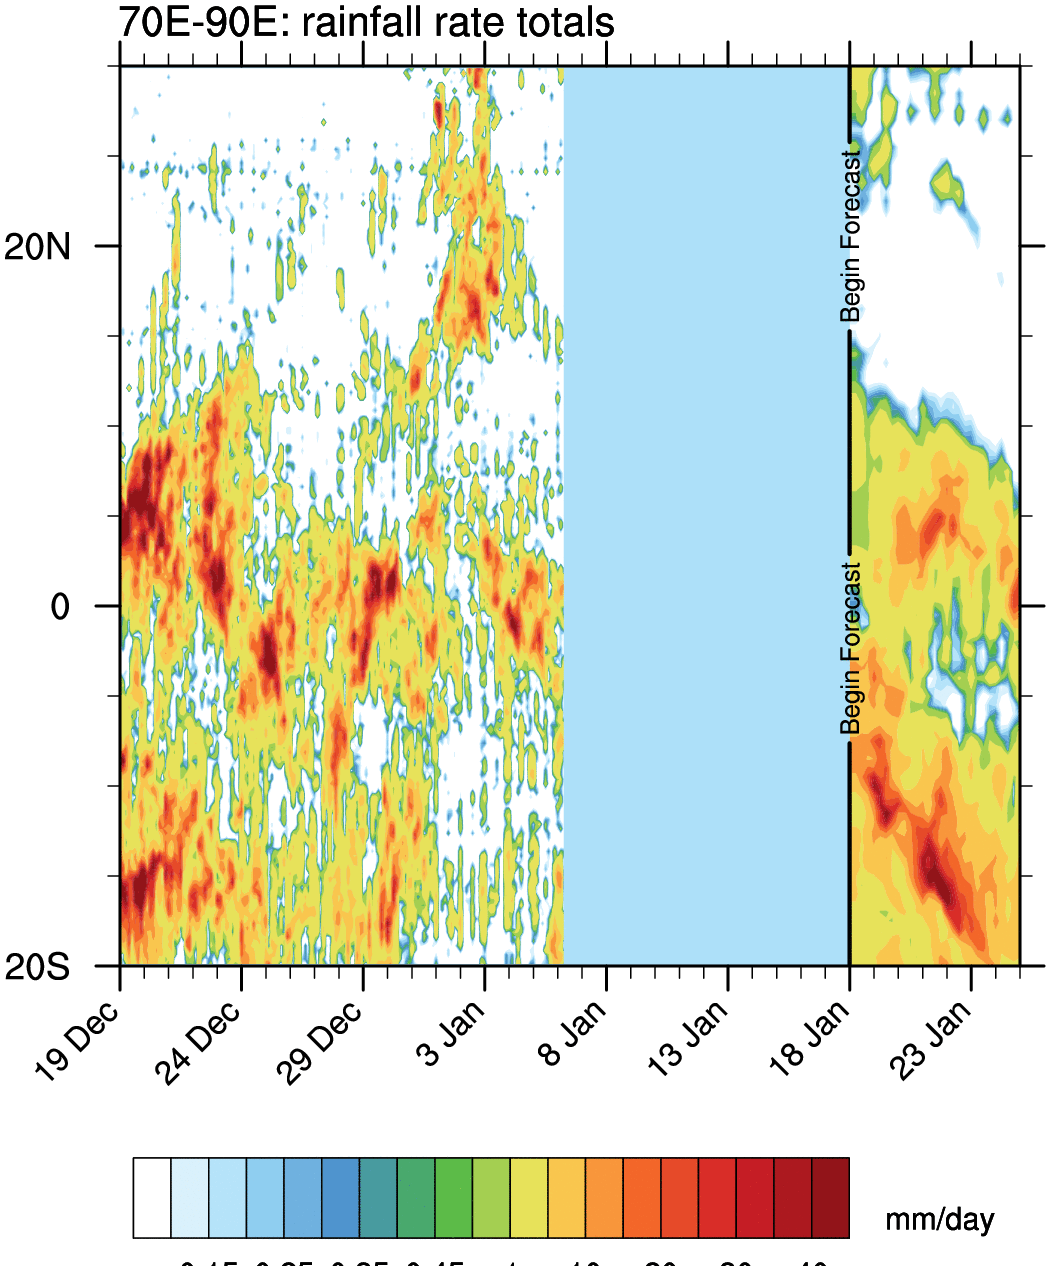
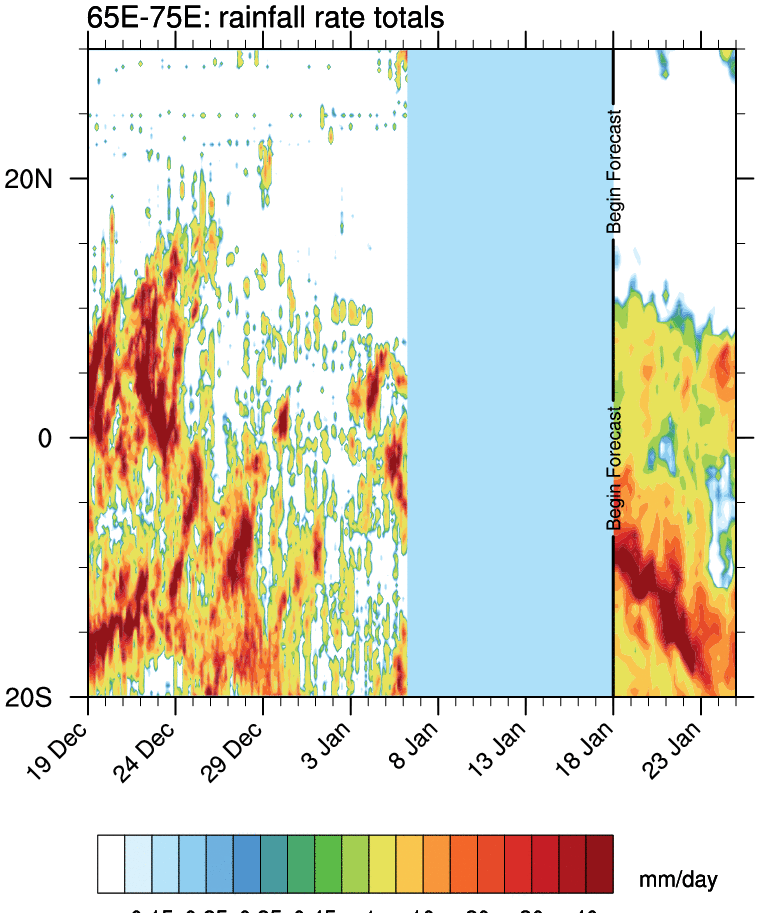
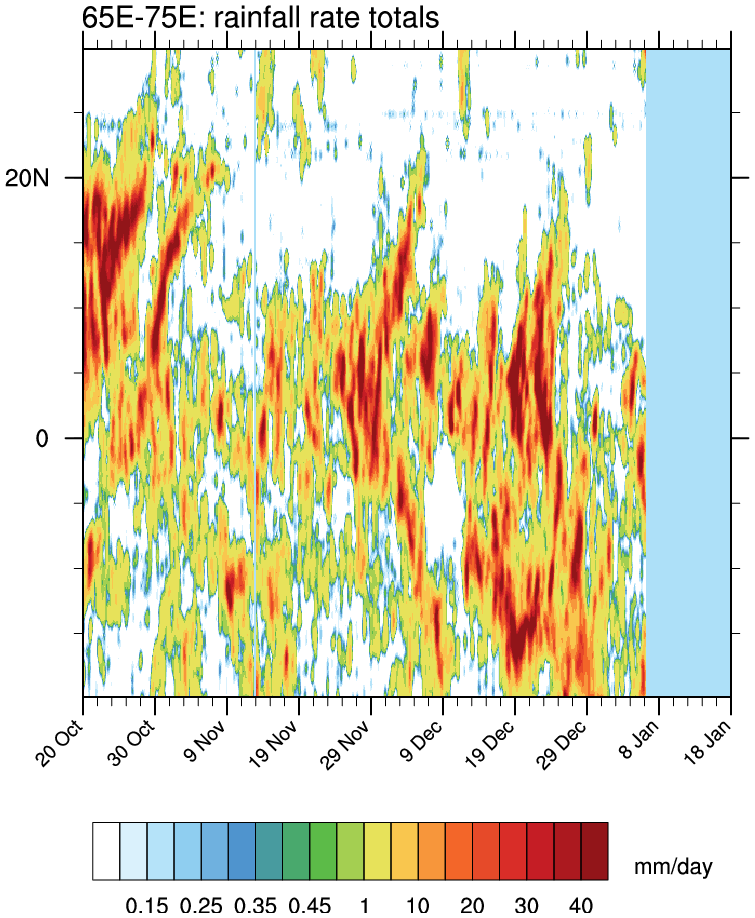
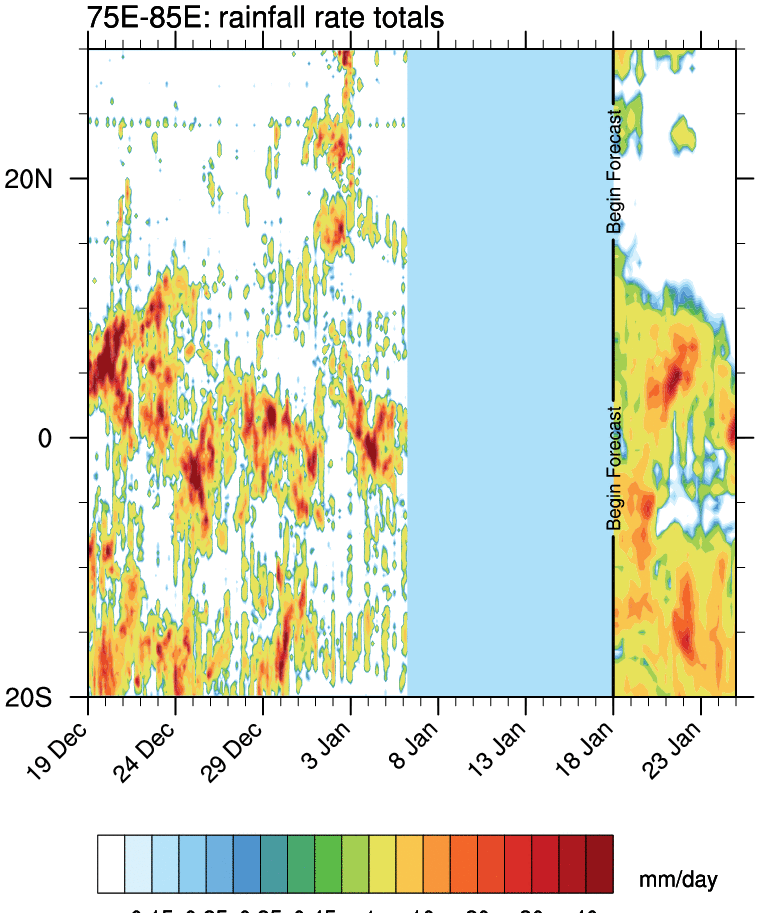
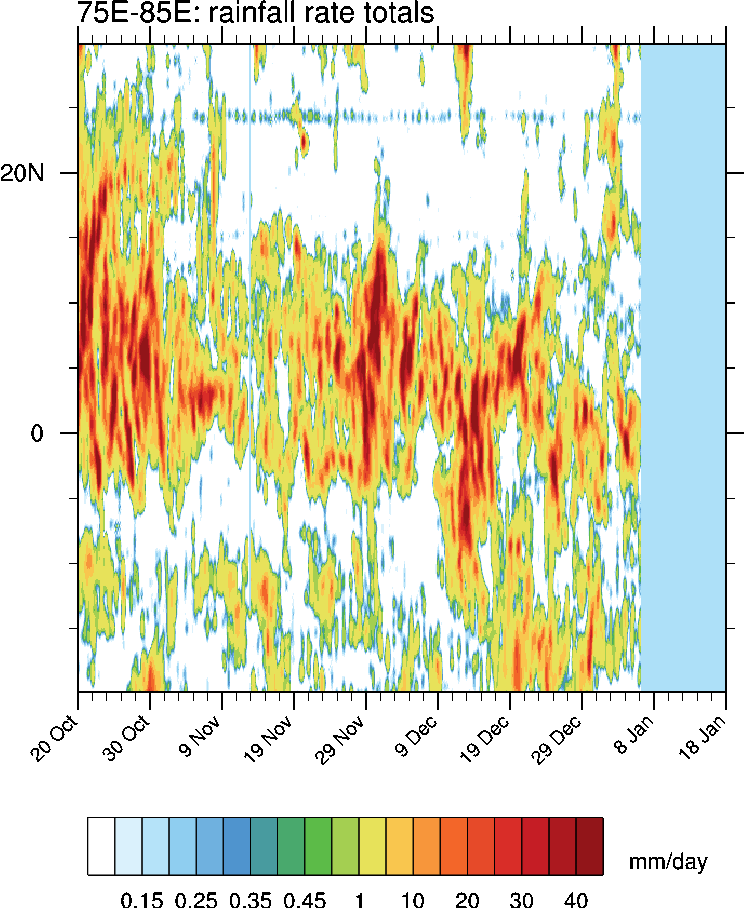
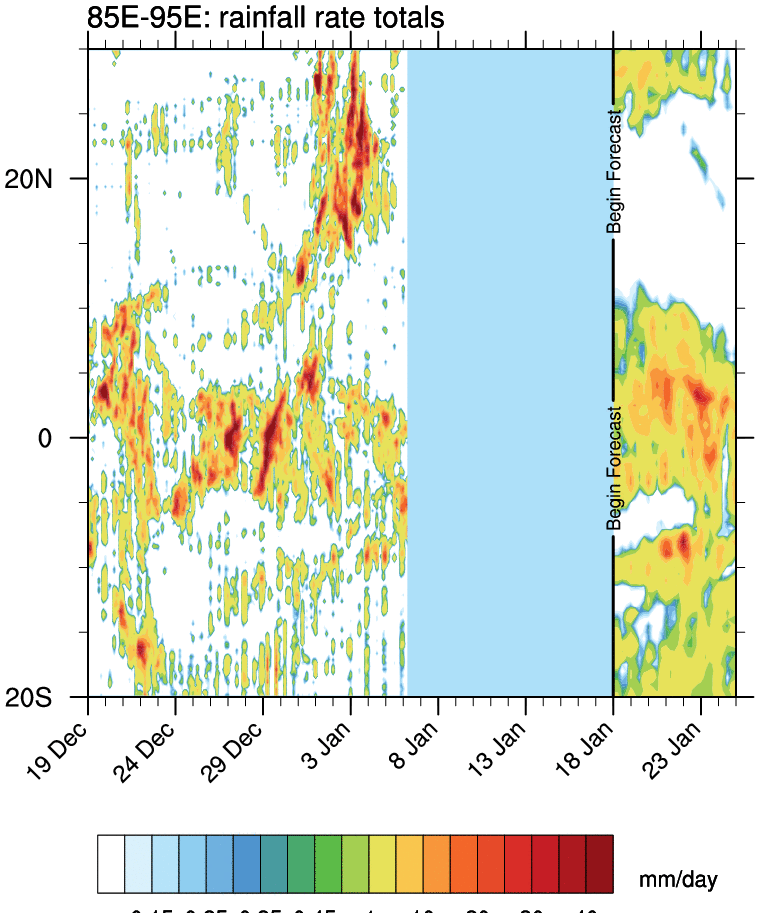
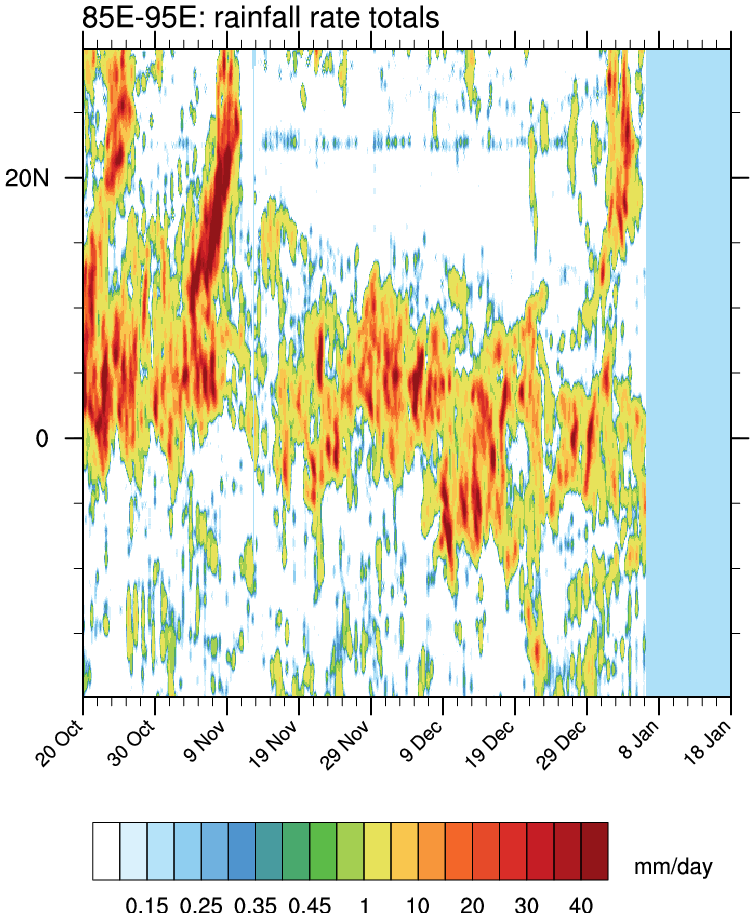
Indian Monsoon regional latitude-time rainfall plots
o Latitude–time plots of rainfall for each region, averaged over the indicated longitude band
o Includes TMPA rainfall rates for the last 30 and 90 days and 0.5° GFS forecasts for the next 7 days on the 30 day plot
o Updated daily at 1200 UTC
70°E – 90°E (Indian Monsoon) 30-Day 90-Day
65°E – 75°E (Arabian Sea) 30-Day 90-Day
75°E – 85°E (Indian Continent) 30-Day 90-Day
85°E – 95°E (Bay of Bengal) 30-Day 90-Day
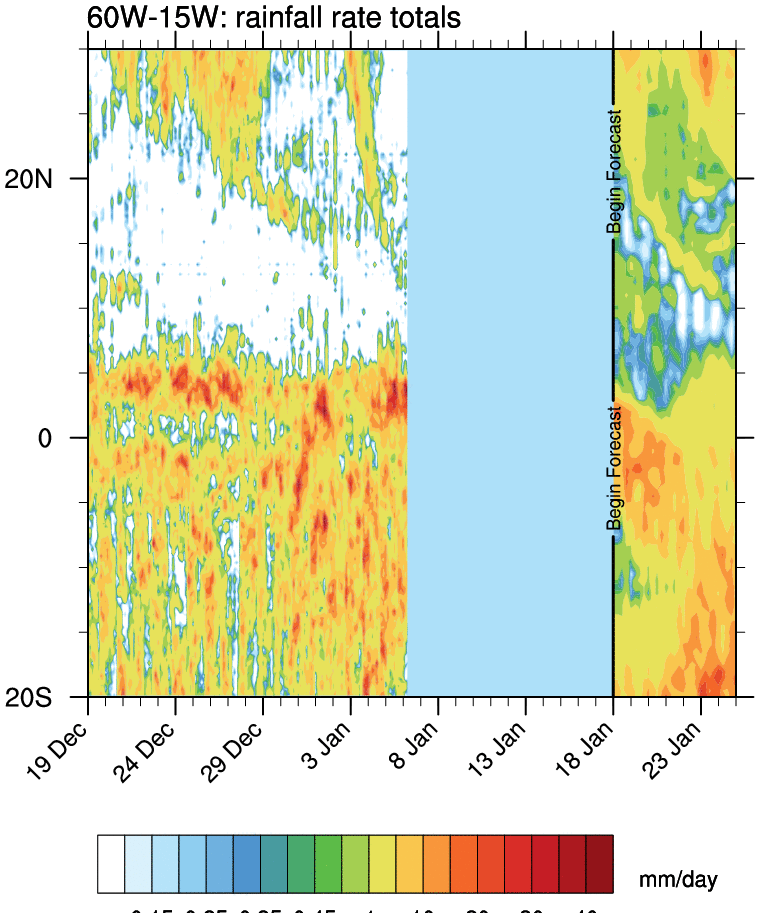
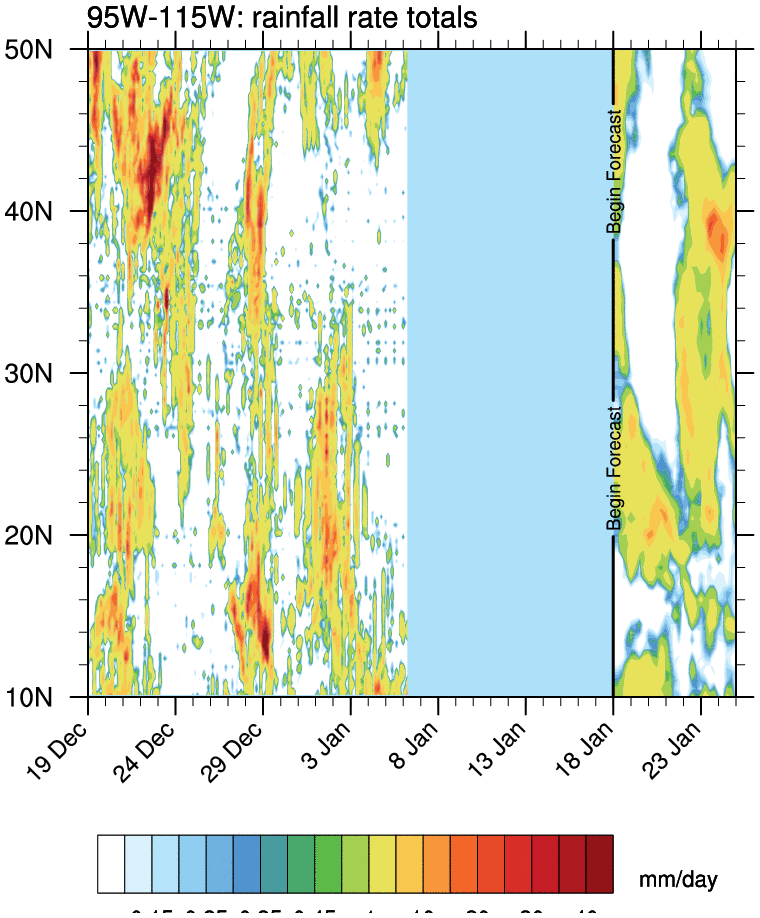
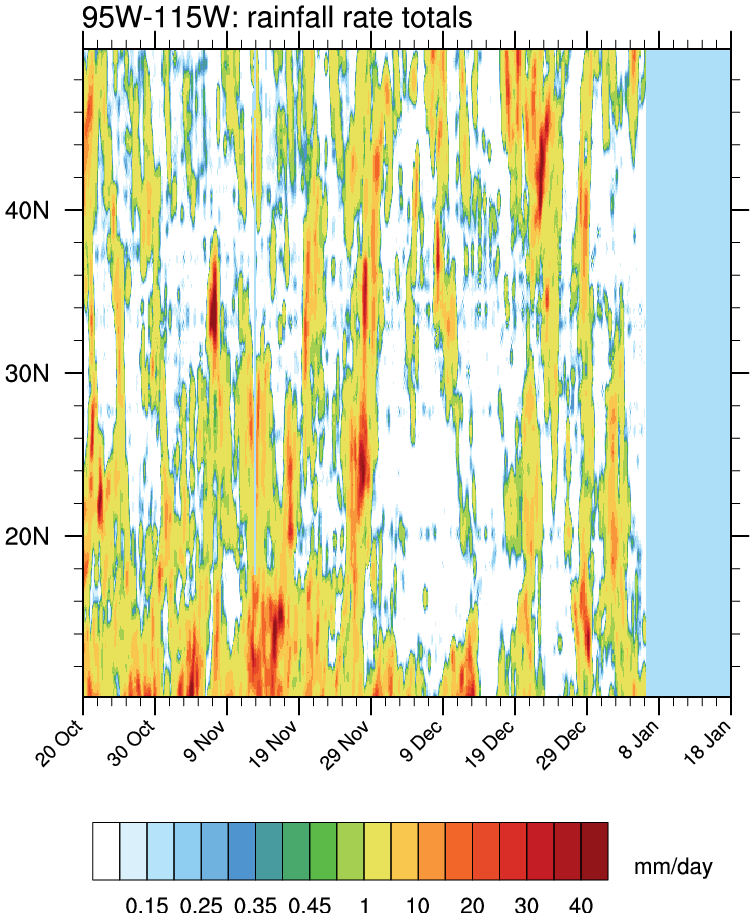
South America latitude-time rainfall plots
o Latitude-time plots of rainfall for each region, averaged over the indicated longitude band
o Includes TMPA rainfall rates for the last 30 and 90 days and 0.5° GFS forecasts for the next 7 days on the 30 day plot
o Updated daily at 1200 UTC
o Climatological rain rates (mm/day) are contoured on the 90 day plots only.
o These plots are used to diagnose equatorward rainfall progression, commonly associated with pressure/cold surges down the Lee of the Andes,
which has been shown to generate Atlantic equatorial convectively-coupled atmospheric Kelvin waves (e.g., Liebmann et al. 2010).
45°W – 75°W (South America) 30-Day 90-Day
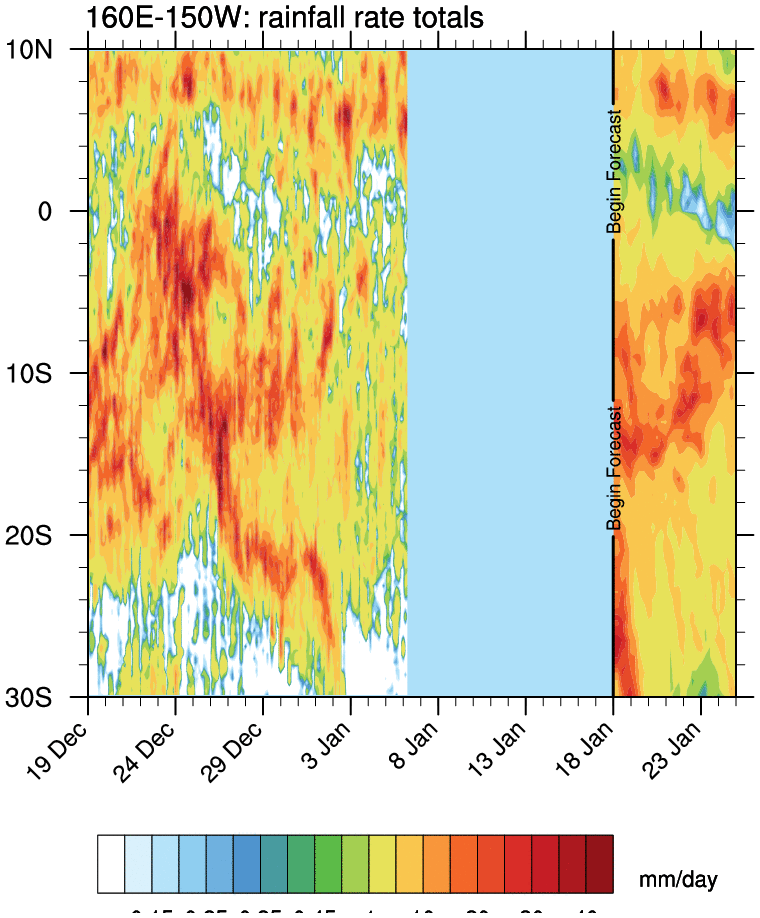
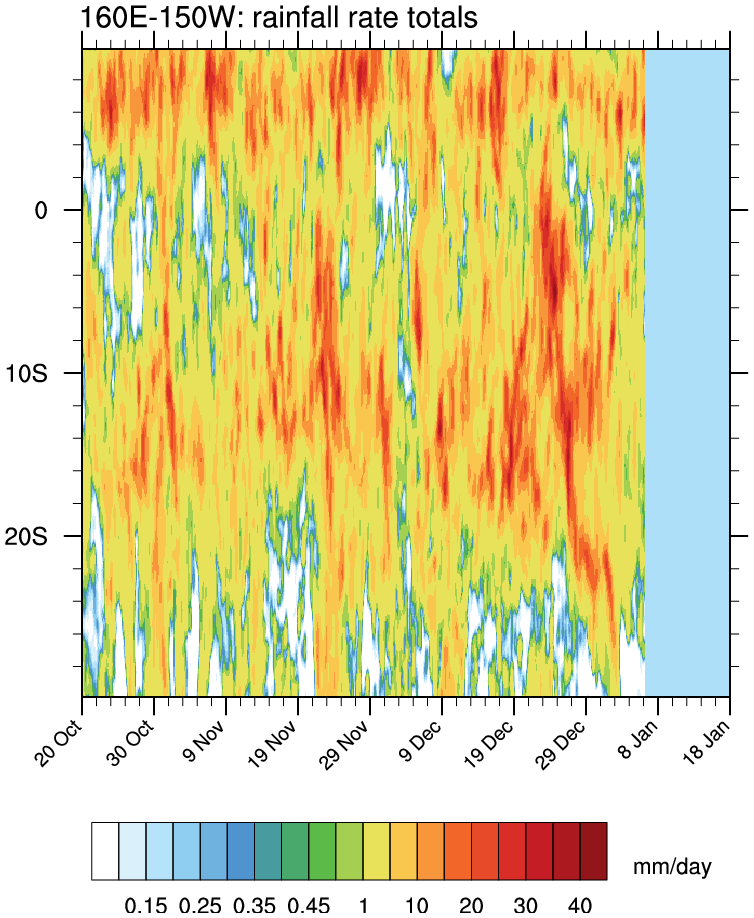
South Pacific Convergence Zone latitude-time rainfall plots
o Latitude–time plots of rainfall for each region, averaged over the indicated longitude band
o Includes TMPA rainfall rates for the last 30 and 90 days and 0.5° GFS forecasts for the next 7 days on the 30 day plot
o Updated daily at 1200 UTC
160°E – 150°W (SPCZ) 30-Day 90-Day
o Includes TMPA rainfall rates for the last 30 and 90 days and 0.5° GFS forecasts for the next 7 days on the 30 day plot
o Updated daily at 1200 UTC
160°E – 150°W (SPCZ) 30-Day 90-Day
